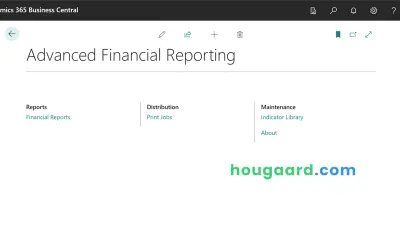
Advanced Financial Reporting
Reporting app for Dynamics 365 Business Central that generates Excel or PowerBI reports from data inside and outside the G/L.
HougaardPaid
Builds customizable financial reports and variance views within Power BI.
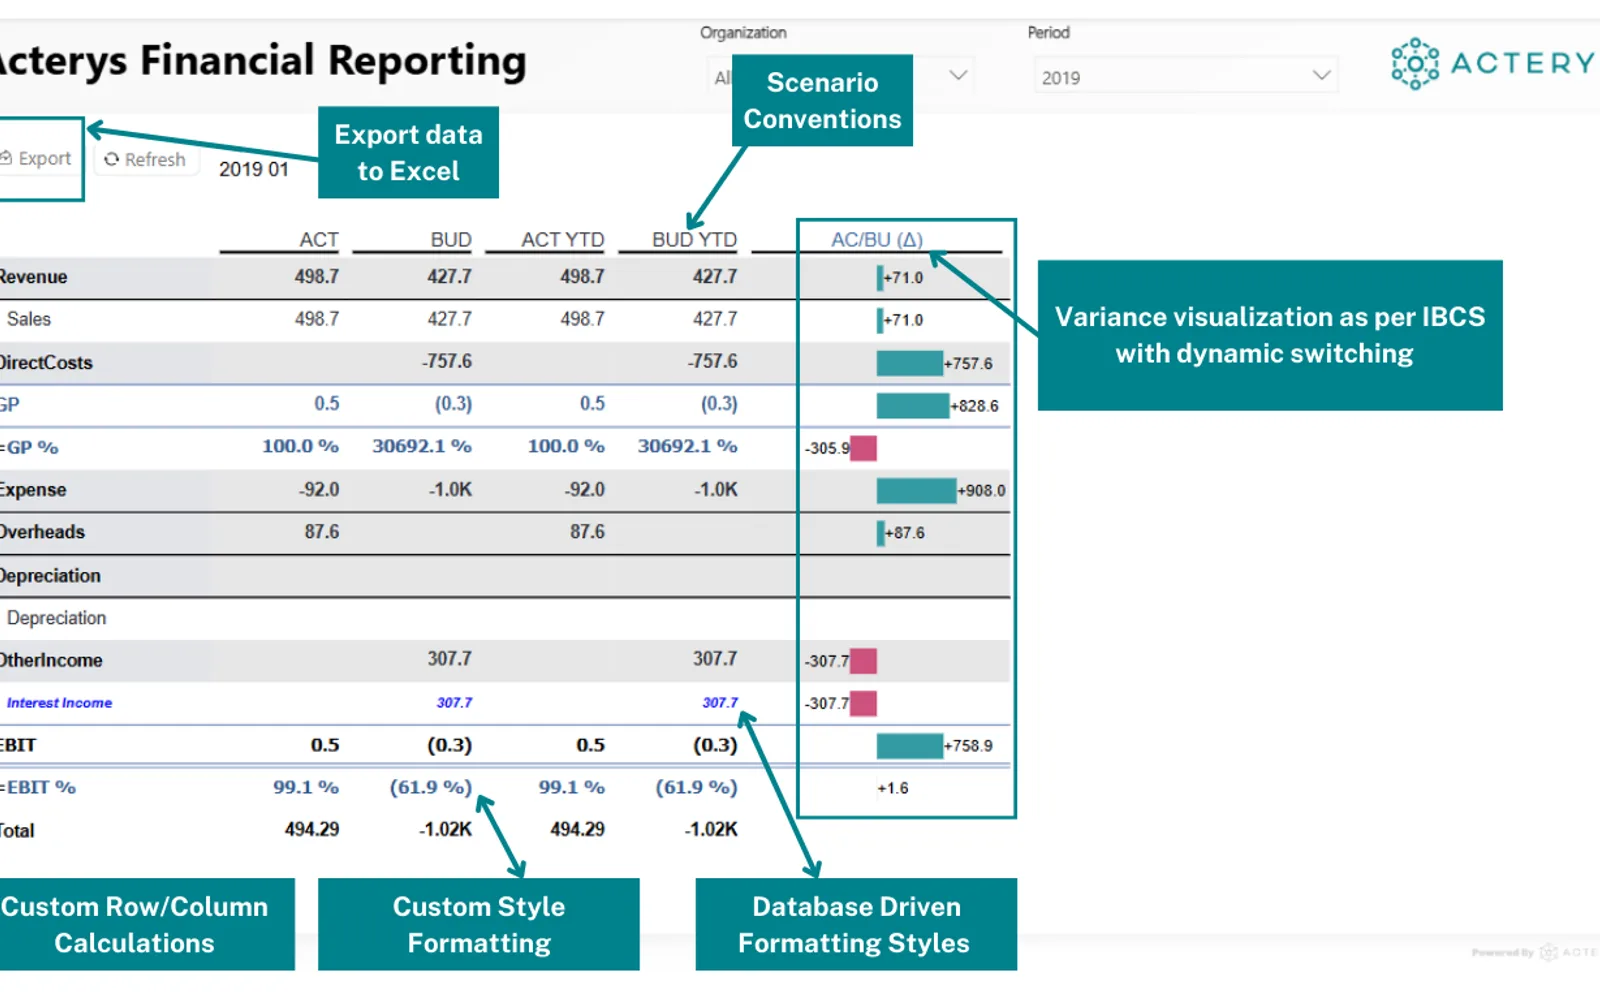
Acterys Reporting adds financial reporting functions to Power BI, including custom calculations, formatting, variance views, and row or cell comments. It also connects Power BI reports with Acterys planning and budgeting functions.
Places subtotals and selected metrics in report rows or columns.
Formats values with percentages, underlining, brackets, and scaling based on the data model.
Shows absolute or relative differences and can include waterfall-style displays.
Adds formatted comments to individual rows or cells.
Connects Power BI with Acterys planning and budgeting functions.
Finance users, analysts, and decision-makers.
Acterys Reporting uses a freemium pricing model and cloud deployment, while Advanced Financial Reporting, Aimplan Planning and Reporting Visual, and AI Financial Intelligence use paid pricing and cloud deployment. The listed alternatives show update dates of Aug 2026, May 2025, and Aug 2026 respectively.
| Name | Pricing | Deployment | Updated |
|---|---|---|---|
| this plugin | Freemium | Cloud | |
| Advanced Financial Reporting | Paid | Cloud | |
| Aimplan Planning and Reporting Visual | Paid | Cloud | |
| AI Financial Intelligence | Paid | Cloud |
1,553 plugins in Power BI · Analytics
Price distribution: 94 free, 141 freemium, 828 paid, 490 price not published
Reporting app for Dynamics 365 Business Central that generates Excel or PowerBI reports from data inside and outside the G/L.
Hougaard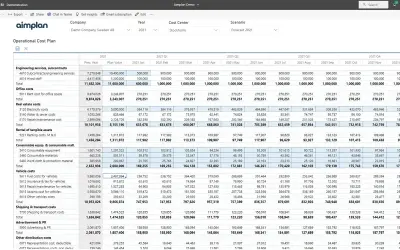
Planning and reporting visual for Power BI that supports budgeting, forecasting, and financial reporting in one tool.
Aimplan AB
Discover the why behind your data.
Data Courage
Gantt Chart is a project management visual for Microsoft Power BI that tracks schedules, milestones, and resource workloads.
ChartPad«Acterys Reporting Acterys Reporting is a streamlined Power BI visual designed for fast, professional financial reporting—no deep DAX knowledge required. Built for teams that need clean, IBCS-compliant reports in Power BI, it offers essential features to customize, comment, and visualize financial data with ease.»