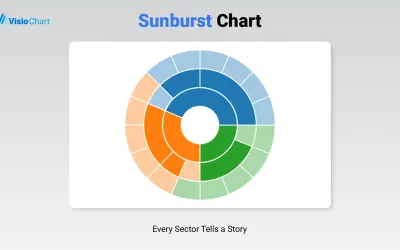
Sunburst Chart
Displays up to five levels of hierarchical data as proportional segments across concentric rings in Power BI reports.
VisioChartFreemium
Create time-location charts for linear project schedules in Microsoft Power BI.
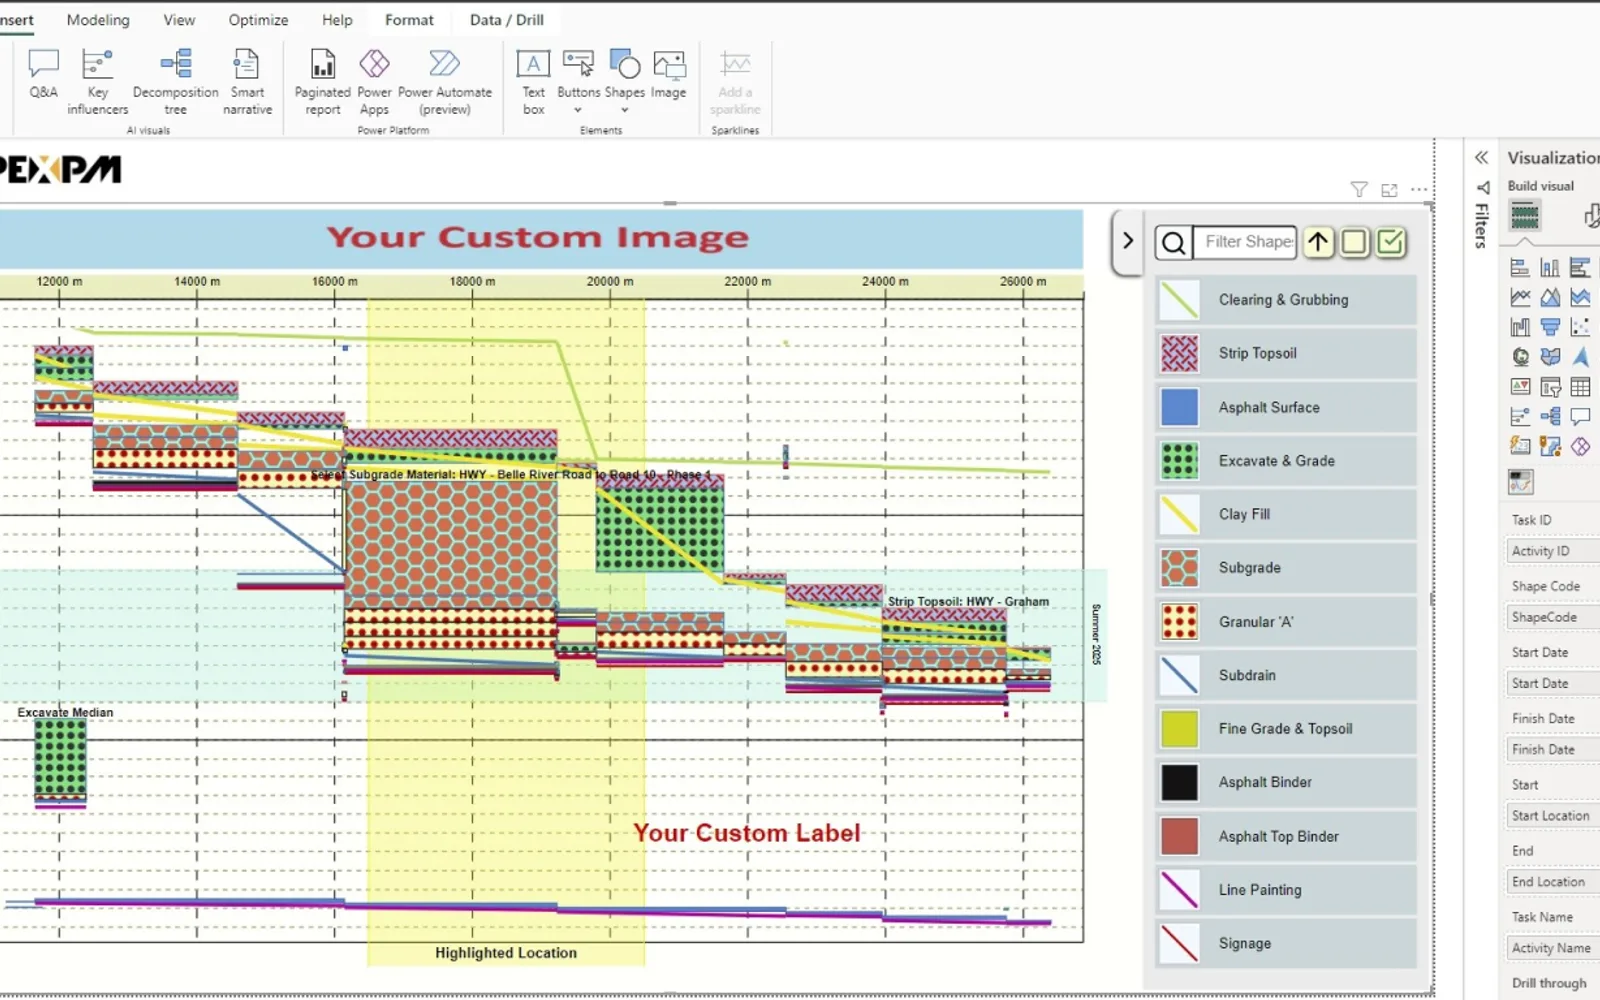
Displays linear project schedules as time-location charts in Microsoft Power BI. It supports schedule customization through shape, order, and display settings for activity types. The visual can include custom images, labels, tooltips, and reversed axes. Zoom, pan, and interaction with other Power BI visuals are also supported.
Defines shapes and ordering for activity types and selects which items appear on the chart.
Provides zoom-in, zoom-out, and pan controls for examining project timelines.
Connects with other Power BI visuals for linked dashboard interactions.
Adds images such as maps, blueprints, or other project imagery to the chart.
Places custom labels anywhere on the chart.
Reverses the chart axis to match the project's orientation.
Creates tooltips containing information for chart viewers.
Project teams, project stakeholders, and professionals in construction, transportation, real estate, infrastructure, and utilities.
Apex Linear Schedule is a freemium cloud listing, as are Sunburst Chart and Lollipop Column Chart. Workday integration by adenin and Sift have unknown pricing models, while Ridgeline Plot by Powerviz is free. All listed alternatives use cloud deployment.
| Name | Pricing | Deployment | Updated |
|---|---|---|---|
| this plugin | Freemium | Cloud | |
| Sunburst Chart | Freemium | Cloud | |
| Lollipop Column Chart | Freemium | Cloud | |
| Workday integration by adenin | Price not published | Cloud | |
| Sift | Price not published | Cloud | |
| Ridgeline Plot by Powerviz | Free | Cloud |
1,365 plugins in Power BI · Analytics
Price distribution: 89 free, 137 freemium, 651 paid, 488 price not published
Displays up to five levels of hierarchical data as proportional segments across concentric rings in Power BI reports.
VisioChart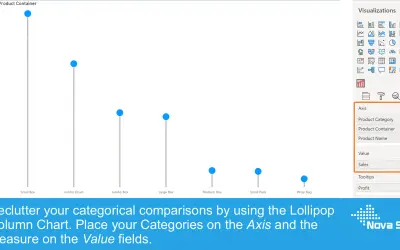
Lollipop Column Chart displays a marker and line per category as an alternative to standard column charts in Power BI.
Nova Silva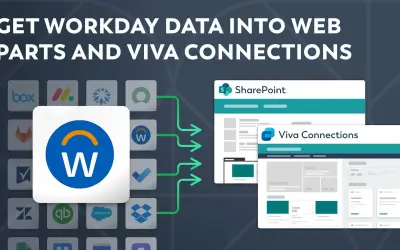
Displays Workday data in SharePoint through a customizable Web part and in Viva Connections via an Adaptive Card extension.
adenin TECHNOLOGIES Inc
Sift provides an interactive org chart, employee profiles, and instant people search within Microsoft Teams and Outlook.
Sift, LLC«Elevate your project scheduling and visualization capabilities with the Apex Linear Schedule visual, the ultimate tool for Microsoft Power BI. This custom visual is purpose-built for linear project types like Tunnels, Railways, Roads, Pipelines, High-Rise Buildings, and more, allowing you to transform complex project …»