Dumbbell Bar Chart
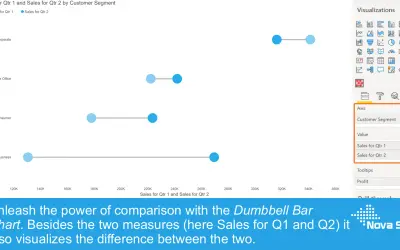
A Power BI visual that compares two results using a marker per value connected by a line, with an optional variance chart.
Nova SilvaFreemiumCompare
147 analytics apps for Microsoft 365
A Power BI visual that compares two results using a marker per value connected by a line, with an optional variance chart.
Nova Silva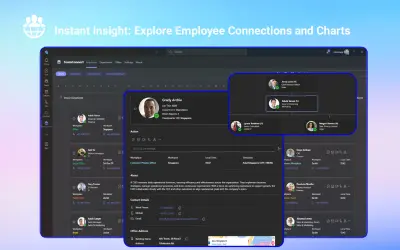
TeamConnect provides an employee directory with org charts and presence data inside Microsoft Teams, Outlook, and Microsoft 365.
CUBEET PTE. LTD.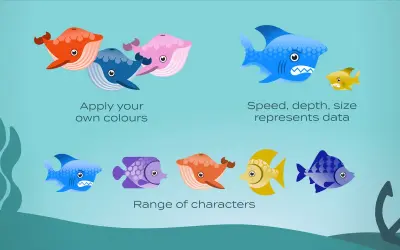
Displays Power BI data as sea creatures in an aquarium, making KPIs, rankings, and performance comparisons interactive.
ENLIGHTEN DESIGNS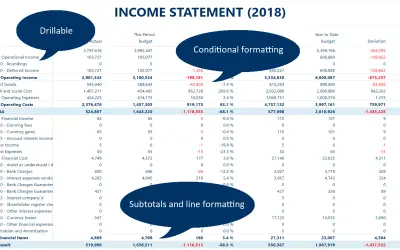
Custom Power BI matrix visual for financial reporting, with subtotals, custom measures, line formatting, and Excel export.
Profitbase AS
Provides analytics and reporting on Azure and Microsoft spending to help organizations track trends and align with budgets.
HABILELABS PRIVATE LIMITED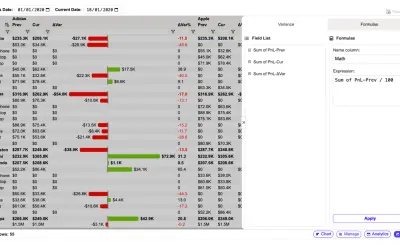
Adds pivoting, variance calculations, and header-based filtering to Power BI for end users of published reports.
FlexaIntel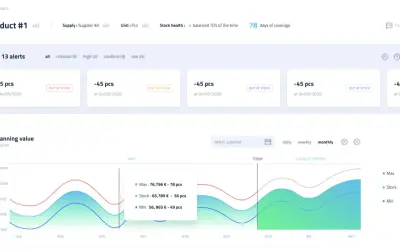
Flowlity forecasts demand and tells each stakeholder what stock level to hold and when to replenish, integrating with any ERP.
Flowlity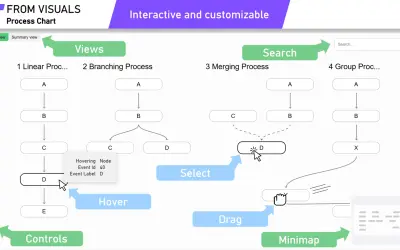
A Power BI visual that charts process-related data in Process and Summary views, with drill-through, search, and event grouping.
From Visuals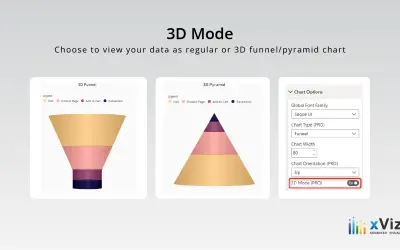
xViz Funnel/Pyramid Chart displays process stages and hierarchies with configurable 2D or 3D views for Power BI reports.
xViz LLC dba Lumel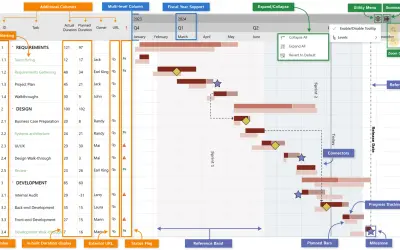
Gantt chart visual for Power BI that breaks projects down into tasks, subtasks, and milestones with dependency tracking.
xViz LLC dba Lumel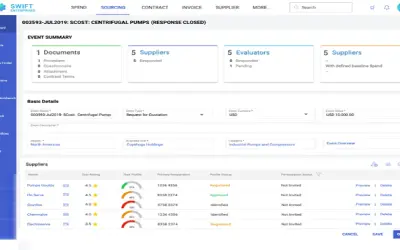
GEP QUANTUM INTELLIGENCE Sourcing supports AI-embedded RFx management, reverse auctions, contract management and analytics.
GEP (NB Ventures)
AI-native Supply Chain and Inventory Optimization for Retailers, Manufacturers, and Distributors Getron AI Services (GaiS) is an AI-native, ERP-agnostic SaaS platform that automates and optimizes supply chain decisions across inventory, replenishment, demand forecasting, supply planning, and pricing.
Getron
Glanceable consolidates public review sources and internal datasets on one platform to identify customer insights and pain points.
Glanceable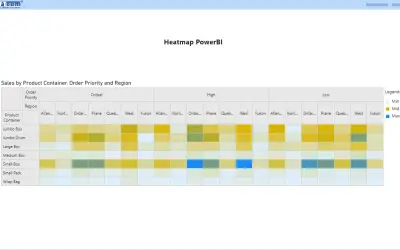
Displays data values as a color-coded cell grid in Power BI, revealing patterns, trends, and correlations in large datasets.
DEFTEAM SOLUTIONS PRIVATE LIMITED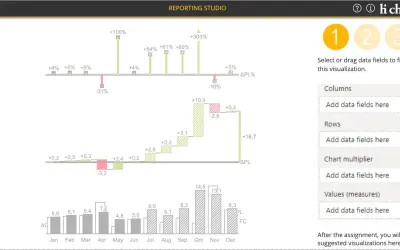
Creates charts, tables and waterfalls in Power BI with a built-in notation concept and automatic variance calculation.
CP Corporate Planning GmbH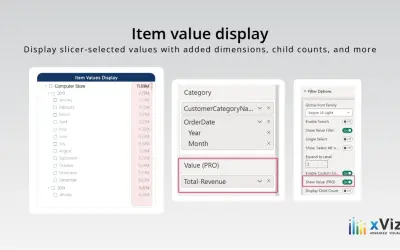
Hierarchical slicer for Power BI that filters values with search, conditional formatting, and expandable parent-child nodes.
xViz LLC dba Lumel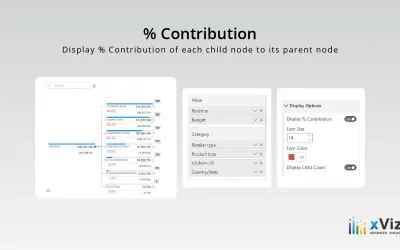
Hierarchy Tree - xViz breaks down categories and dimensions into detailed levels for reporting in Power BI.
xViz LLC dba Lumel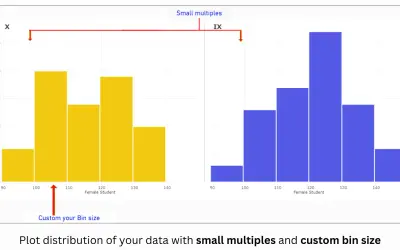
Creates histograms in Microsoft Power BI with customizable bins, cumulative and stacked variations, and reference lines.
PBIVizEdit.com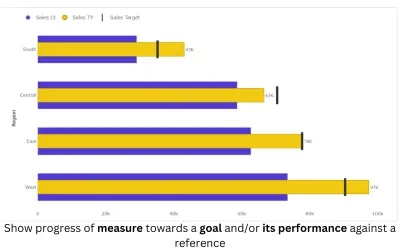
Horizontal bullet chart custom visual for Microsoft Power BI with small multiples, reference lines, and conditional formatting.
PBIVizEdit.com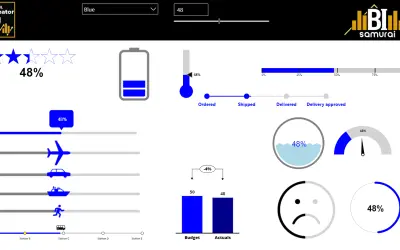
HTML visual for Power BI reports that adds custom SVG visualizations, charts, KPI cards, tables, and web-based media.
BI Samurai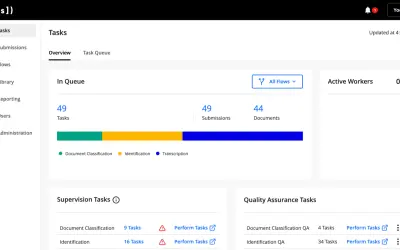
Converts documents into validated, machine-readable data for the Hyperscience Platform using proprietary machine learning.
Hyperscience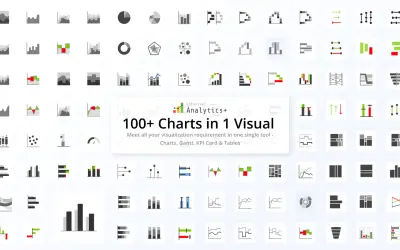
Adds 100+ chart types, Gantt, KPI cards, and table visuals to Microsoft Power BI for report building and analysis.
xViz LLC dba Lumel