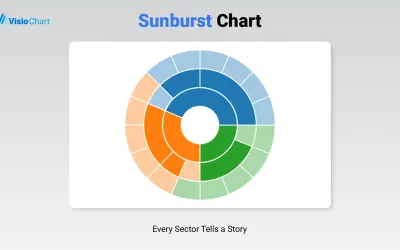
Sunburst Chart
Displays up to five levels of hierarchical data as proportional segments across concentric rings in Power BI reports.
VisioChartFreemium
Visualizes category shares in Power BI with a customizable pie chart, labels, tooltips, legends, animations, and slice filtering.
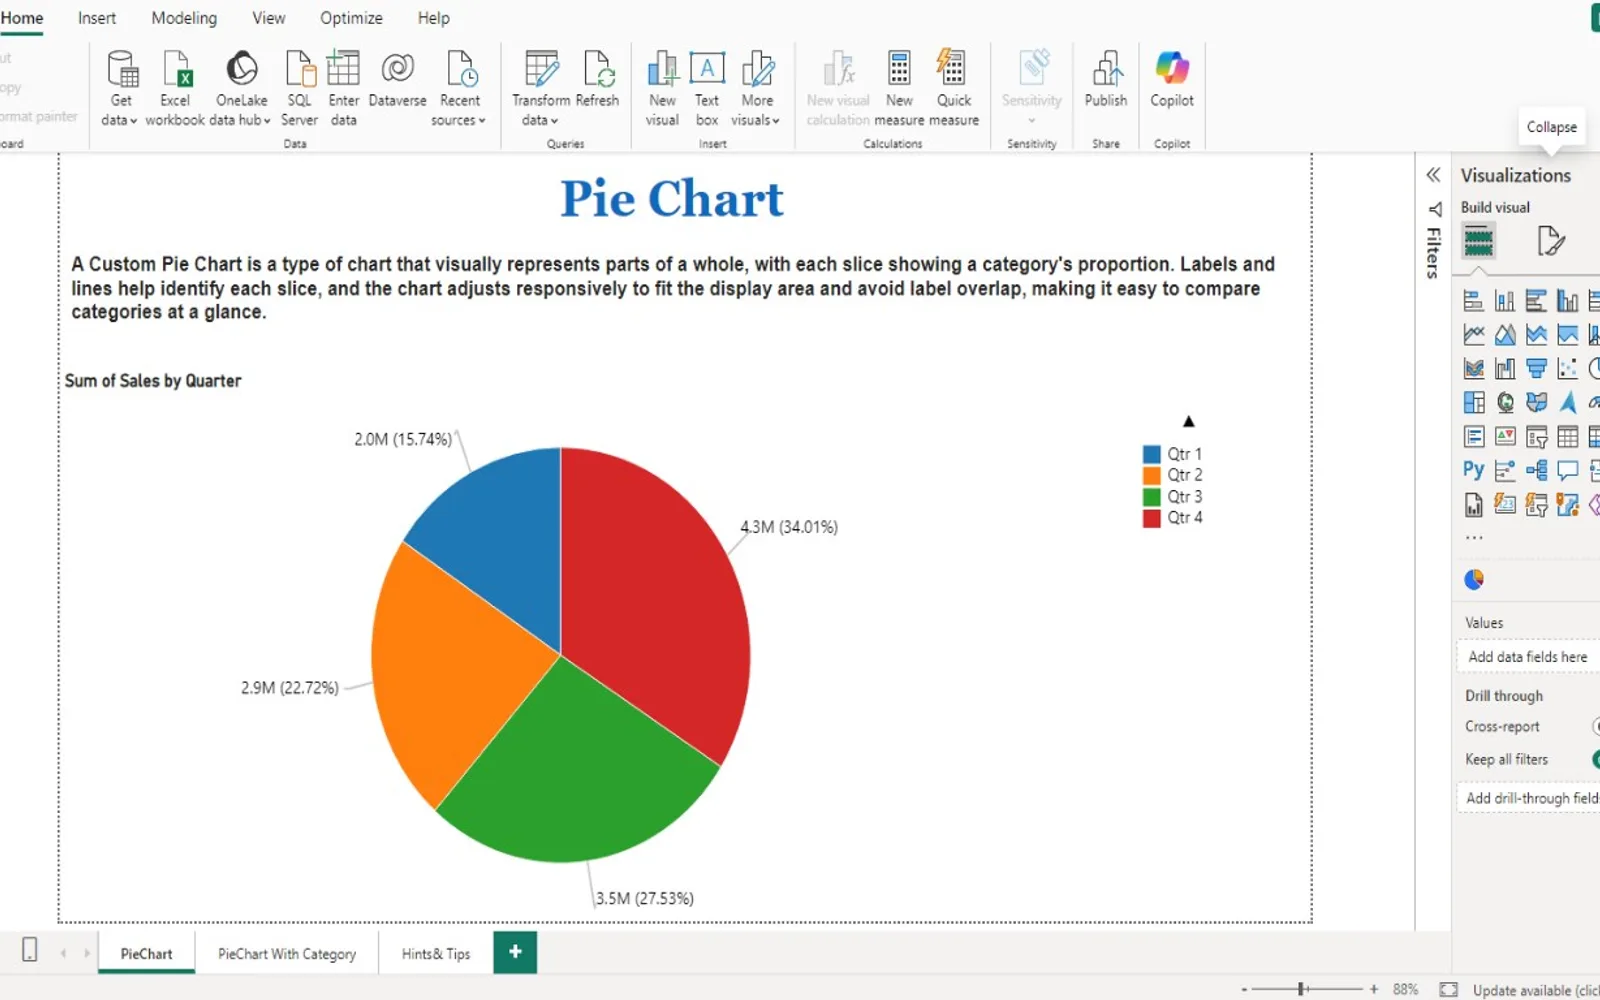
Displays data as colored pie slices, with each slice representing a category's share of the whole. The visual supports category labels, dynamic colors, interactive tooltips, optional legends, and animations. Users can adjust width and rotation, configure label formatting, assign slice colors, and click slices to filter the dataset. Legends label slices, while tooltips show additional details on hover.
Assigns specific colors to individual data categories.
Toggles labels and adjusts their font size, color, units, and numeric precision.
Adds slice labels through legends and displays additional details when hovering over slices.
Filters the dataset when a slice is selected.
Rotates the chart to change its viewing angle.
Changes the chart's overall size and proportions.
PieChart by iFour is paid, while Sunburst Chart and Advanced Pie and Donut - xViz are freemium, and Waffle Chart Maker is free. All three alternatives use cloud deployment, as does PieChart by iFour. Sunburst Chart, Advanced Pie and Donut - xViz, and Waffle Chart Maker show an update date of Dec 2025, compared with PieChart by iFour's Nov 2025 update date.
| Name | Pricing | Deployment | Updated |
|---|---|---|---|
| this plugin | Paid | Cloud | |
| Sunburst Chart | Freemium | Cloud | |
| Advanced Pie and Donut - xViz | Freemium | Cloud | |
| Waffle Chart Maker | Free | Cloud |
657 plugins in Power BI · Analytics
Price distribution: 73 free, 108 freemium, 441 paid, 35 price not published
Displays up to five levels of hierarchical data as proportional segments across concentric rings in Power BI reports.
VisioChart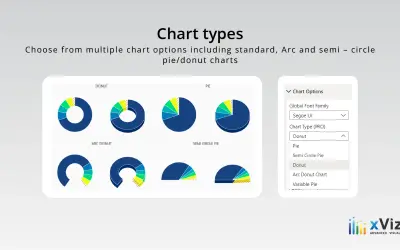
An xViz pie and donut chart for Power BI that compares parameters and displays each part's proportion of the whole.
xViz LLC dba Lumel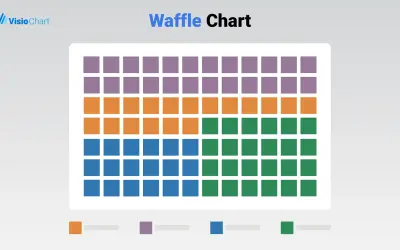
Waffle Chart Maker renders grid-based charts from numbers or percentages with sorting and cross-filtering for Microsoft Power BI.
VisioChart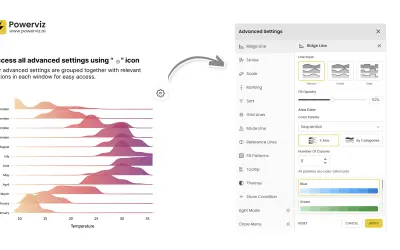
Custom Power BI visual that plots numeric distributions for multiple categories as stacked curves along a common continuous axis.
TRUVIZ INC«A custom visual pie chart divides data into colored slices, each representing a category with size proportional to its share of the whole. Features include category labels, dynamic colors, interactive tooltips, and optional legends and animations. Users can click slices for filtering, making it ideal for visually …»