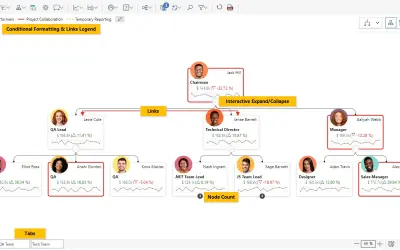
Performance Flow - xViz
Power BI visual for tracking supply chain, sales, and financial performance with interactive diagrams, alerts, and KPIs.
xViz LLC dba LumelFreemium
Explore hierarchical relationships with a radial tree visual in Power BI.
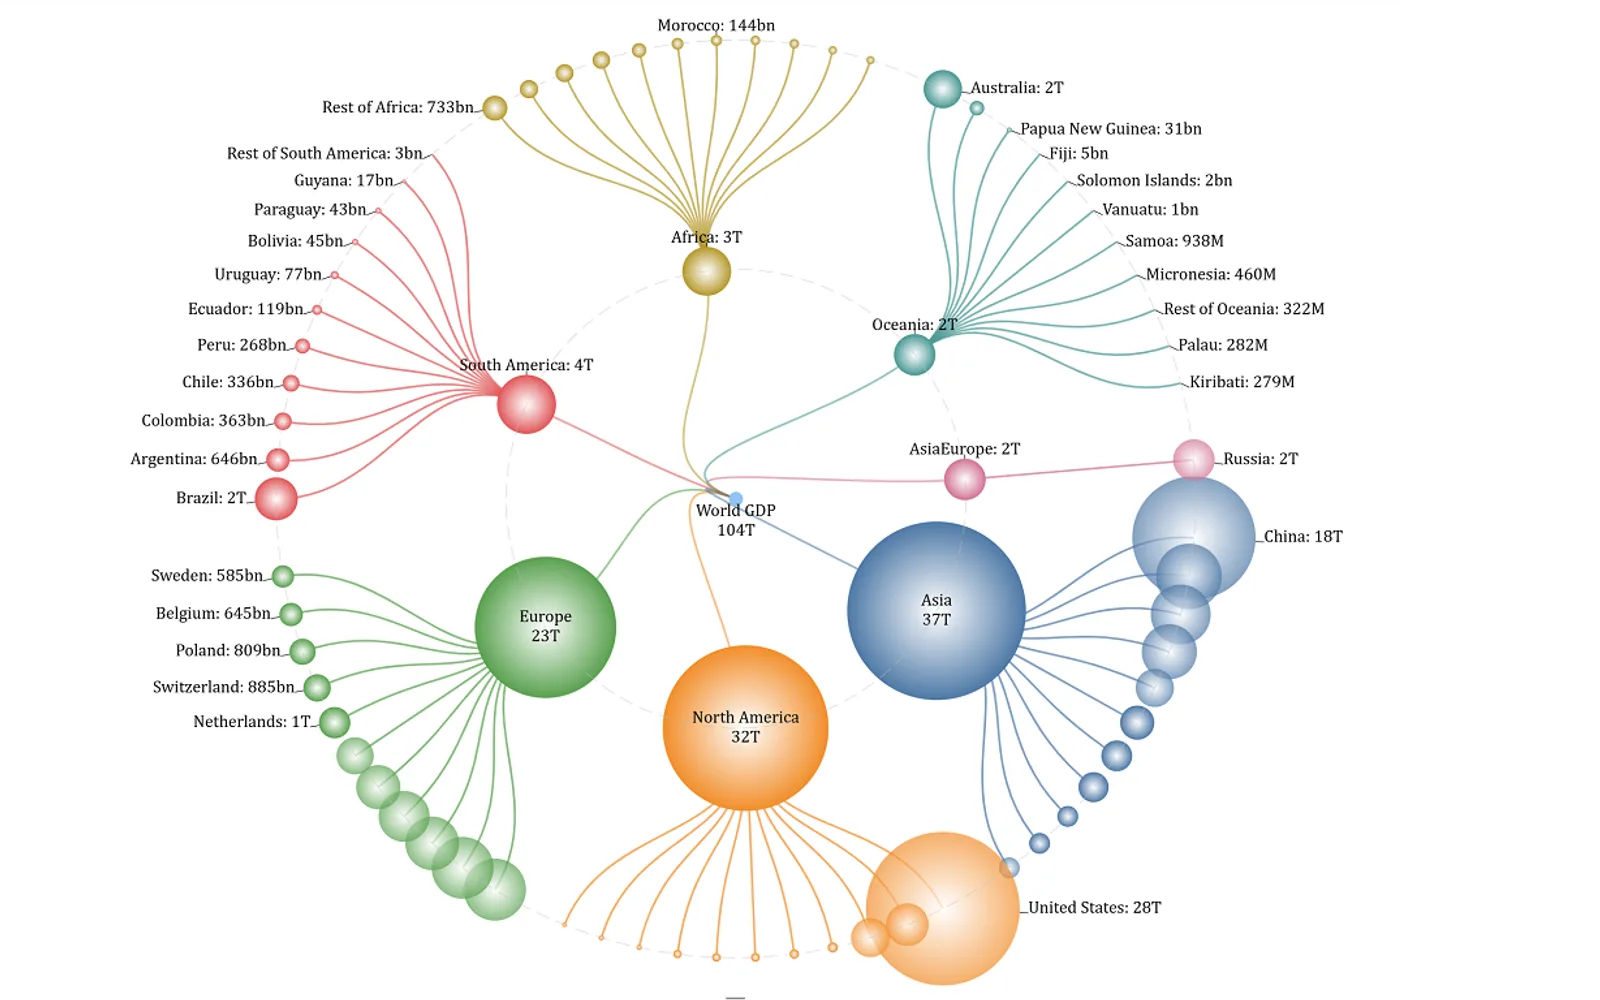
Arranges nodes in concentric circles and shows parent-child connections with radial links. The visual supports zooming and panning, configurable node colors, labels, and levels, and animated branch expansion or collapse. It is available without charge in Power BI Desktop and displays a watermark in Power BI Online unless a license subscription is purchased.
Arranges hierarchy nodes in concentric circles with radial links between parents and children.
Provides zoom and pan controls for exploring large hierarchies.
Supports configuration of node colors, labels, and levels.
Animates the expansion and collapse of hierarchy branches.
657 plugins in Power BI · Analytics
Price distribution: 73 free, 108 freemium, 441 paid, 35 price not published
Power BI visual for tracking supply chain, sales, and financial performance with interactive diagrams, alerts, and KPIs.
xViz LLC dba Lumel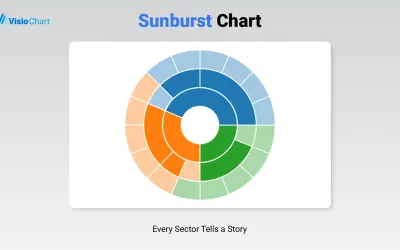
Displays up to five levels of hierarchical data as proportional segments across concentric rings in Power BI reports.
VisioChart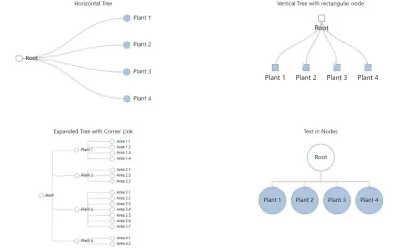
Tree for Power BI offers tree structure navigation with options for orientation, labels, node shape, and conditional formatting.
CK Corporation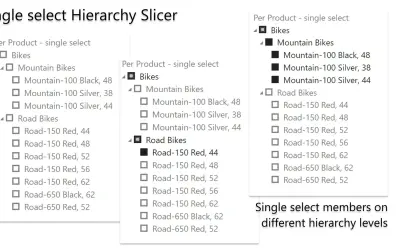
HierarchySlicer is a Power BI visual that filters report items using expandable or collapsible ad-hoc or pre-defined hierarchies.
DataScenarios«This visual was developed in partnership with Hamed Behairy - CFA. one of top financial trainers in the world. The Radial Tree visual allows users to explore hierarchical relationships in an intuitive and engaging way. Designed for clarity and aesthetics, it arranges nodes in concentric circles, displaying …»