
Gantt Chart
Gantt Chart is a project management visual for Microsoft Power BI that tracks schedules, milestones, and resource workloads.
ChartPadFree
Column chart visual for Power BI with flower-based breakdowns of parent and child category fields.
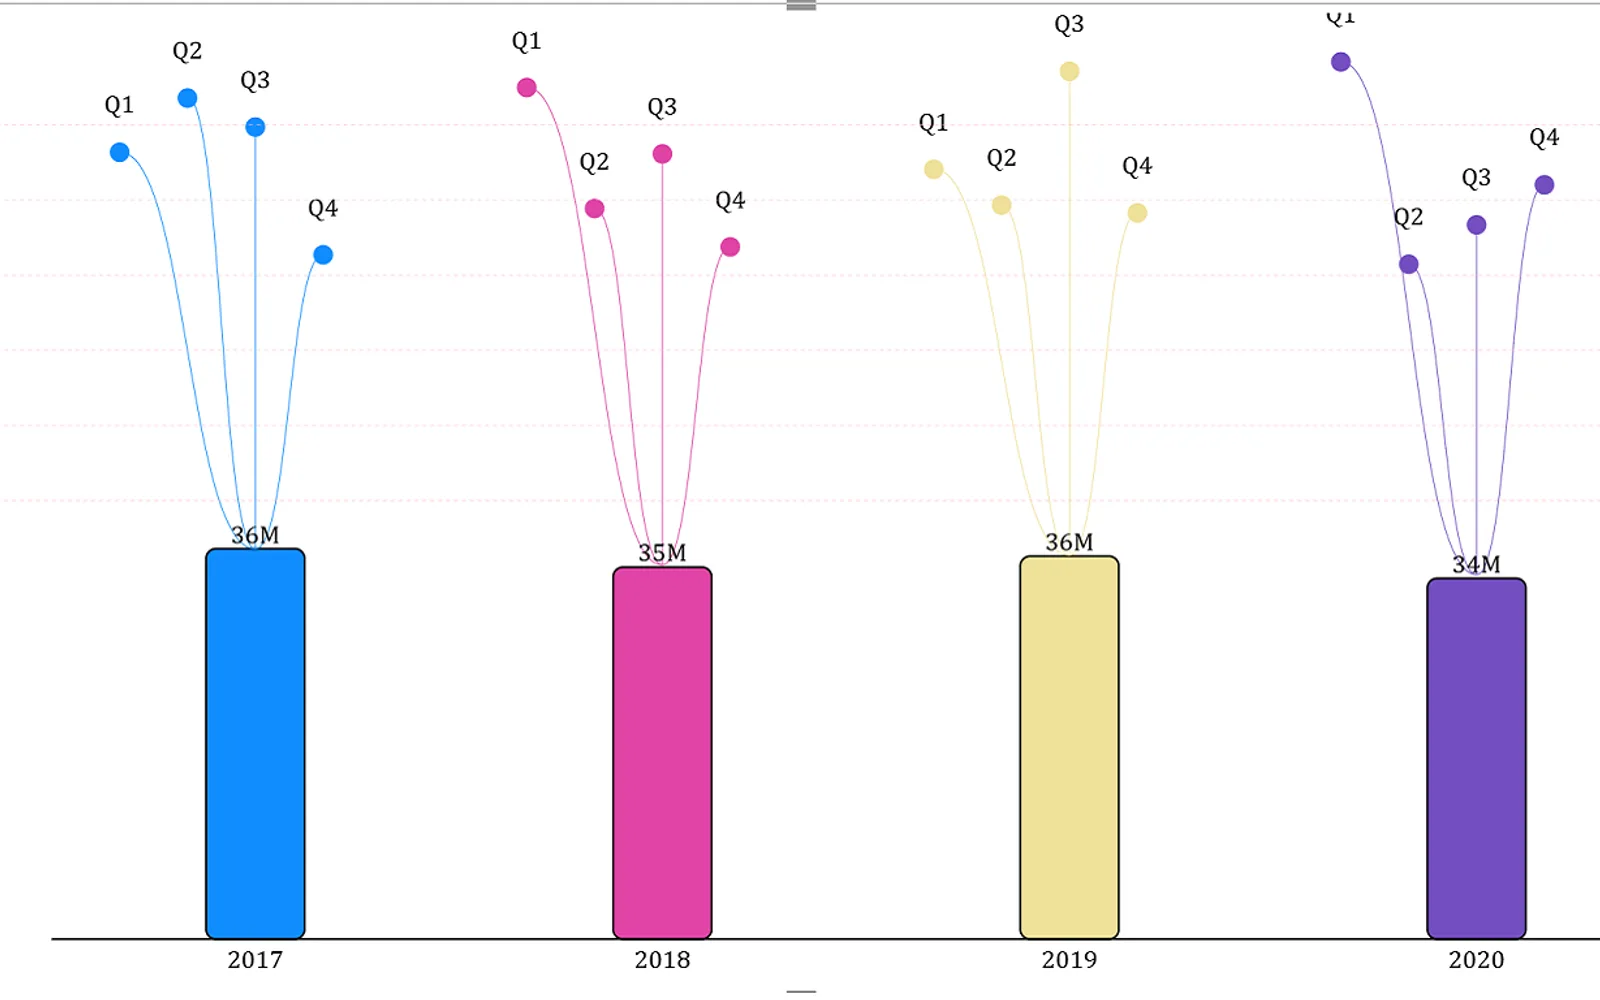
Dandelion displays data as a column chart with breakdowns shown as flowers above the columns. It represents parent and child relationships between two fields in the Category section. For example, yearly sales can appear as columns with monthly breakdowns shown as flowers above each column. The visual is free in Power BI Desktop; Power BI Online displays a watermark unless a license subscription is purchased.
Visualizes data as a column chart.
Shows data breakdowns as dandelion flowers above the columns.
Depicts the relationship between two fields placed in the Category section.
Uses a sales value or other measure field placed in the Measure section.
657 plugins in Power BI · Analytics
Price distribution: 73 free, 108 freemium, 441 paid, 35 price not published
Gantt Chart is a project management visual for Microsoft Power BI that tracks schedules, milestones, and resource workloads.
ChartPad
Creates visualizations from diverse chart types, combines multiple charts on one canvas, and adds custom annotations and tooltips.
Akvelon
Creates financial and business reports in Power BI with automatic variance calculations, P&L logic, and drill-down (s5, s6).
Zebra BI
AI analysis app for Dynamics 365 Business Central that provides customer KPIs, churn probability, and customer grouping.
Data Courage«This visual was developed in partnership with Hamed Behairy - CFA. one of top financial trainers in the world Dandelion chart visualizes your data in the form of a column chart plus the breakdown of your data as Dandelion flowers above the columns. This visual offers a unique and wholistic way to depict the parent / …»