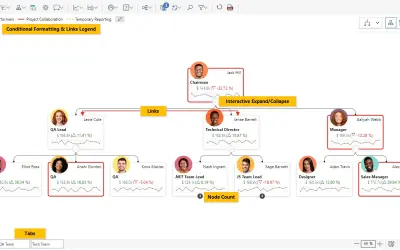
Performance Flow - xViz
Power BI visual for tracking supply chain, sales, and financial performance with interactive diagrams, alerts, and KPIs.
xViz LLC dba LumelFreemium
Analyze Power BI measures by contributing factors across multiple dimensions and levels of detail.
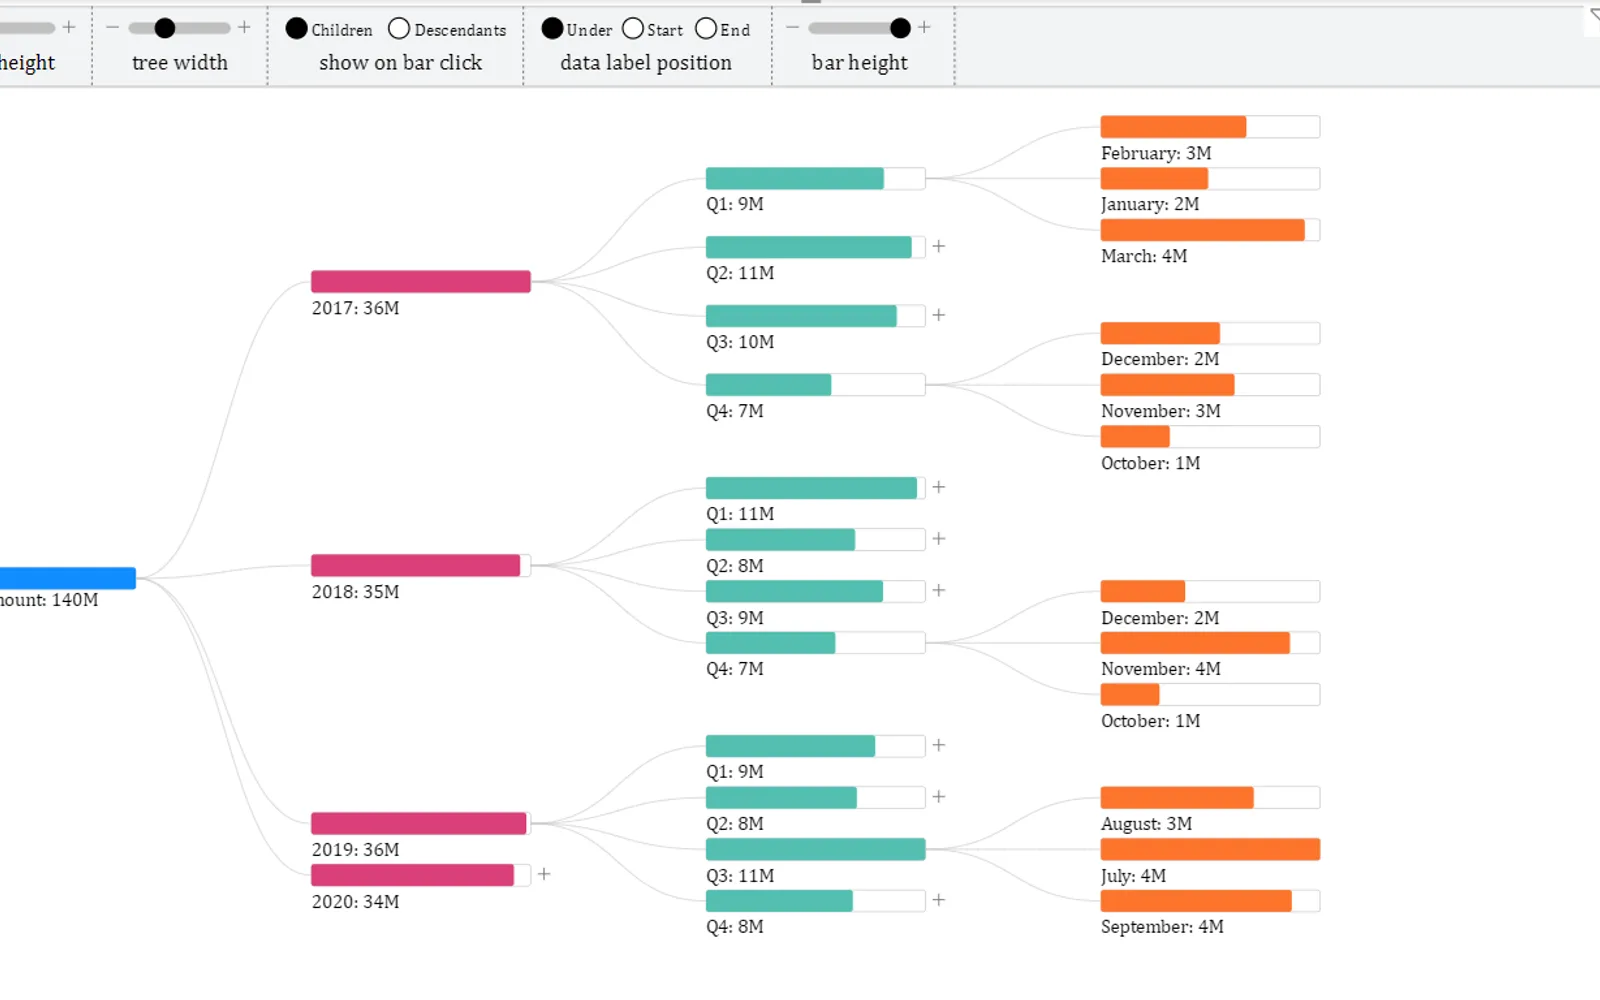
Breaks down a measure or metric into contributing factors for exploratory data analysis. The visual supports interactive exploration, data aggregation, and drill-down across multiple dimensions and levels of granularity. In Power BI Desktop, its functionality is available for free; in Power BI Online Service, a watermark appears unless a license subscription is purchased.
Breaks down a measure or metric into contributing factors.
Provides an interactive visual interface for exploring data.
Aggregates data and supports drill-down.
Analyzes data across multiple dimensions and levels of granularity.
This listing is paid and uses cloud deployment, while Performance Flow - xViz is freemium with cloud deployment. Tree is also paid with cloud deployment; Performance Flow - xViz was updated in Dec 2025 and Tree in Sep 2025.
| Name | Pricing | Deployment | Updated |
|---|---|---|---|
| this plugin | Paid | Cloud | |
| Performance Flow - xViz | Freemium | Cloud |
657 plugins in Power BI · Analytics
Price distribution: 73 free, 108 freemium, 441 paid, 35 price not published
Power BI visual for tracking supply chain, sales, and financial performance with interactive diagrams, alerts, and KPIs.
xViz LLC dba Lumel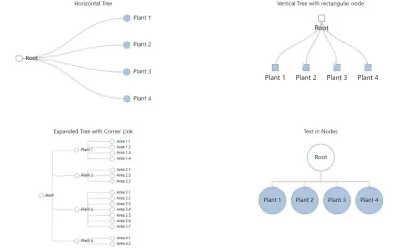
Tree for Power BI offers tree structure navigation with options for orientation, labels, node shape, and conditional formatting.
CK Corporation
Gantt Chart is a project management visual for Microsoft Power BI that tracks schedules, milestones, and resource workloads.
ChartPad
Creates visualizations from diverse chart types, combines multiple charts on one canvas, and adds custom annotations and tooltips.
Akvelon«This visual developed in partnership with Hamed Behairy - CFA. one of top financial trainers in the world Decomposition Tree Visual is a very useful tool for exploratory data analysis. It allows you to break down a measure or metric into its contributing factors, helping to understand how different dimensions …»