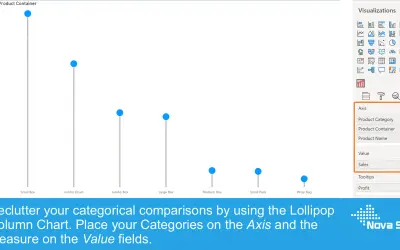
Lollipop Column Chart
Lollipop Column Chart displays a marker and line per category as an alternative to standard column charts in Power BI.
Nova SilvaFreemium
Shows individual data points and their distribution along the y-axis in Power BI.
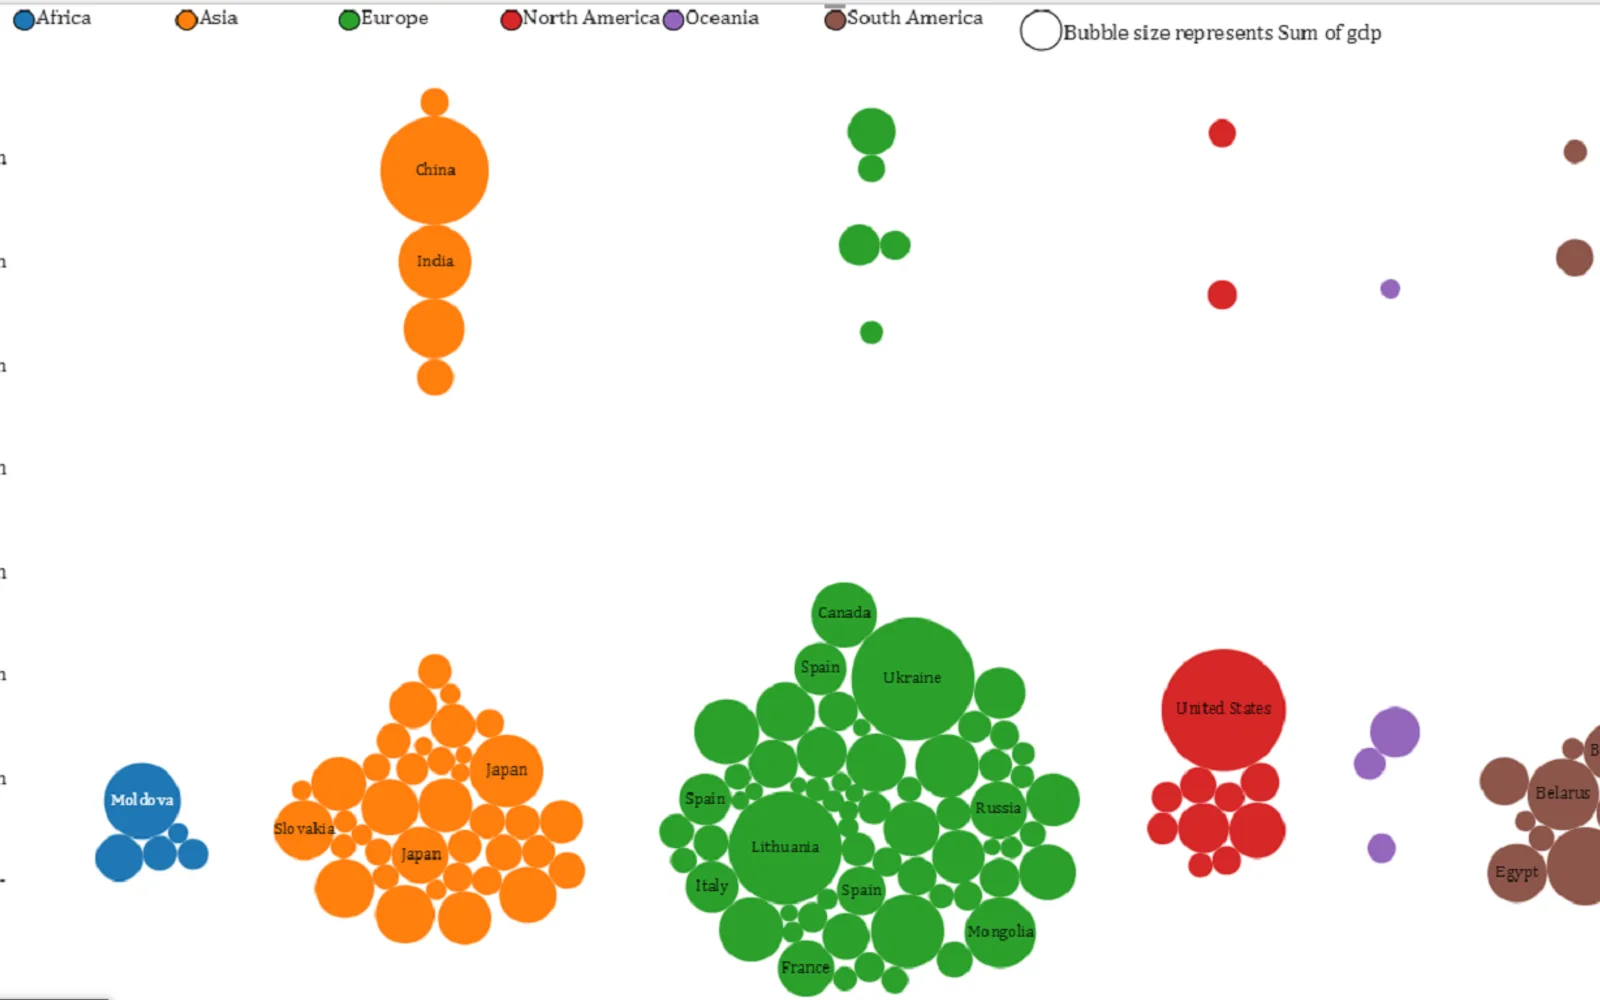
Displays data distribution along the y-axis while showing individual points. The visual uses closely packed, non-overlapping points in a one-dimensional scatter plot format. It is free in Power BI Desktop and displays a watermark in Power BI Online Service unless licensed.
Shows how data is distributed along the y-axis.
Displays individual points within the distribution.
Uses a one-dimensional scatter plot format.
Arranges points in closely packed, non-overlapping positions.
Beeswarm Chart is paid and cloud-deployed, while Bubble Chart with Categorical Data (Pro), Lollipop Column Chart, and Dual Y-Axis Combo Chart (Standard) are freemium and cloud-deployed. Ridgeline Plot by Powerviz is free and cloud-deployed, while Multi Line Chart with Tooltips is paid and cloud-deployed. Beeswarm Chart was updated on Aug 2026, compared with alternative update dates ranging from Jan 2025 to Aug 2026.
| Name | Pricing | Deployment | Updated |
|---|---|---|---|
| this plugin | Paid | Cloud | |
| Bubble Chart with Categorical Data (Pro) | Not in catalog | ||
| Lollipop Column Chart | Freemium | Cloud | |
| Dual Y-Axis Combo Chart (Standard) | Freemium | Cloud | |
| Ridgeline Plot by Powerviz | Free | Cloud | |
| Multi Line Chart with Tooltips | Paid | Cloud | |
657 plugins in Power BI · Analytics
Price distribution: 73 free, 108 freemium, 441 paid, 35 price not published
Lollipop Column Chart displays a marker and line per category as an alternative to standard column charts in Power BI.
Nova Silva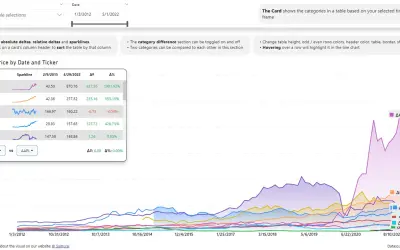
Power BI visual that compares categories over time, with YoY, MoM, YTD and MTD calculations, deltas and sparklines.
Datanauts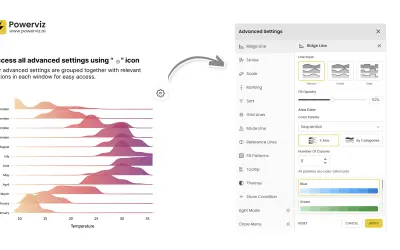
Custom Power BI visual that plots numeric distributions for multiple categories as stacked curves along a common continuous axis.
TRUVIZ INC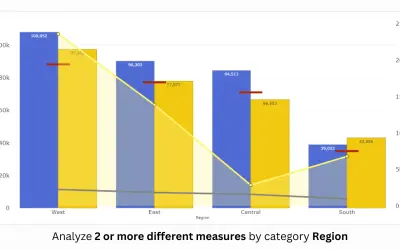
PBIVizEdit custom visual for Power BI that builds dual y-axis charts combining line, area, scatter, and column series.
PBIVizEdit.com«This visual was developed in partnership with Hamed Behairy - CFA. one of top financial trainers in the world Beeswarm chart shows the distribution of data along y axis while also showing individual points. It is like a one-dimensional scatter plot but with closely-packed, non-overlapping points. All functionalities …»