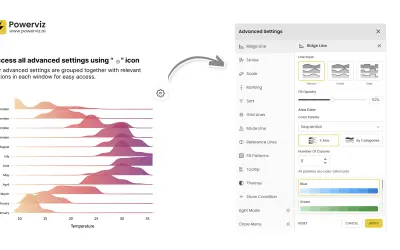
Ridgeline Plot by Powerviz
Custom Power BI visual that plots numeric distributions for multiple categories as stacked curves along a common continuous axis.
TRUVIZ INCFree
Compare time-based data in Power BI using a multi-series chart, tables, hover details, and period metrics.
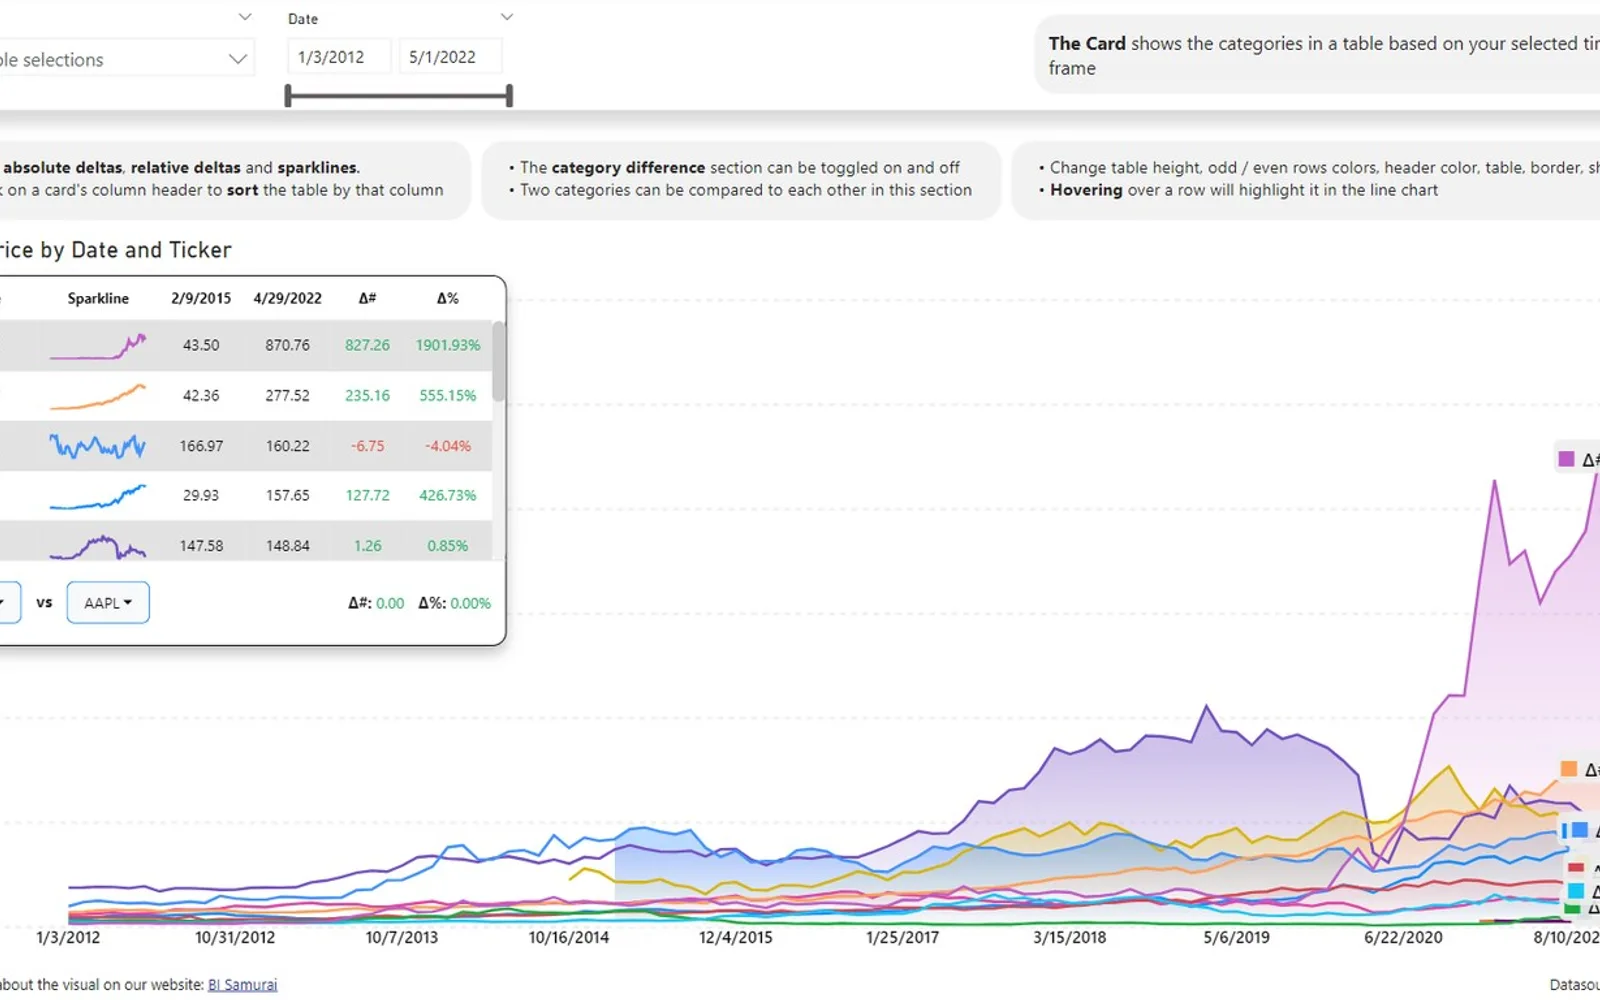
This Power BI visual presents several categories across a time axis and includes hover details, labels, and support for multiple measures. Two table-style areas organize categories for a chosen period, with controls for sorting, selection, highlighting, comparisons, deltas, and sparklines. Chart ranges can be selected by dragging, while table selections filter the displayed lines. The X axis accepts continuous dates and date hierarchies; long ranges use sampling.
Plots several categories across time in one line chart.
Offers year-over-year, month-over-month, year-to-date, and month-to-date calculations.
Displays category data in two table areas tied to the selected time period.
Allows a time interval to be selected by dragging across the chart.
Shows additional chart information when hovering over a line.
Accepts continuous dates and date hierarchies along the horizontal axis.
Power BI users.
This listing is paid and cloud-deployed. Ridgeline Plot by Powerviz is free and cloud-deployed, while Bullet Chart - xViz, Dual Y-Axis Combo Chart (Standard), and Advanced Pie and Donut - xViz are freemium and cloud-deployed. The listing shows an update date of Jan 2025; the alternatives show update dates of Dec 2025, Jul 2026, or Aug 2026.
| Name | Pricing | Deployment | Updated |
|---|---|---|---|
| this plugin | Paid | Cloud | |
| Ridgeline Plot by Powerviz | Free | Cloud | |
| Bullet Chart - xViz | Freemium | Cloud | |
| Dual Y-Axis Combo Chart (Standard) | Freemium | Cloud | |
| Advanced Pie and Donut - xViz | Freemium | Cloud |
657 plugins in Power BI · Analytics
Price distribution: 73 free, 108 freemium, 441 paid, 35 price not published
Custom Power BI visual that plots numeric distributions for multiple categories as stacked curves along a common continuous axis.
TRUVIZ INC
Power BI visual for comparing actuals against targets, with IBCS-certified bullet chart templates and comparison bands.
xViz LLC dba Lumel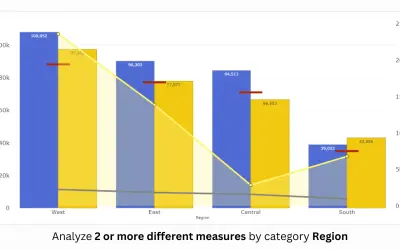
PBIVizEdit custom visual for Power BI that builds dual y-axis charts combining line, area, scatter, and column series.
PBIVizEdit.com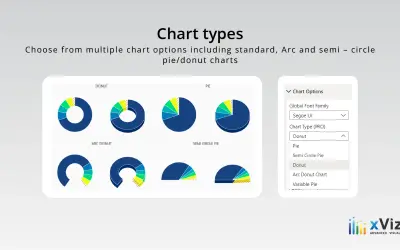
An xViz pie and donut chart for Power BI that compares parameters and displays each part's proportion of the whole.
xViz LLC dba Lumel«The Multi Line Chart With Tooltips was developed to offer more options for comparing time series data for all Power BI users. The visual has many features put together that can help get more out of your time series data. • The card is the space where your categories are sorted in a tabular format.»