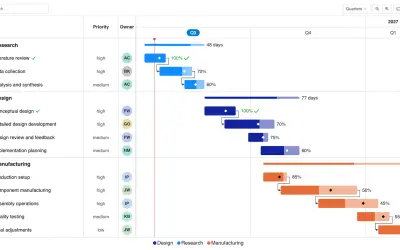
Gantt Chart
Gantt Chart is a project management visual for Microsoft Power BI that tracks schedules, milestones, and resource workloads.
ChartPadFree
Connects email, phone, and mobile messaging support with Power BI.
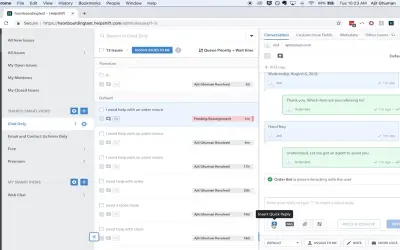
Helpshift connects conventional customer service channels, including email and phone support, with mobile messaging. Its AI-powered customer service platform handles customer service issues across these channels.
Connects email-based customer service with mobile messaging.
Connects phone-based customer service with mobile messaging.
Supports messaging for consumers who use mobile phones.
Provides an AI-powered platform for customer service.
145 plugins in Power BI · Customer Service
Price distribution: 3 free, 5 freemium, 80 paid, 57 price not published
Gantt Chart is a project management visual for Microsoft Power BI that tracks schedules, milestones, and resource workloads.
ChartPad
Creates visualizations from diverse chart types, combines multiple charts on one canvas, and adds custom annotations and tooltips.
Akvelon
Creates financial and business reports in Power BI with automatic variance calculations, P&L logic, and drill-down (s5, s6).
Zebra BI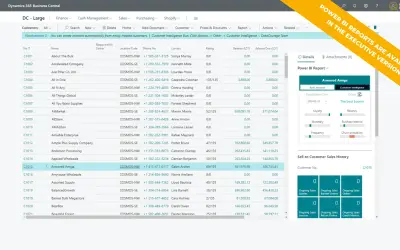
AI analysis app for Dynamics 365 Business Central that provides customer KPIs, churn probability, and customer grouping.
Data Courage«Helpshift bridges the disconnect between conventional customer service channels — such as email and phone support — and a growing consumer base that does more on mobile phones and has a strong preference for messaging as the primary mode of communication. Through Helpshift’s AI-powered customer service platform …»