
Gantt Chart
Gantt Chart is a project management visual for Microsoft Power BI that tracks schedules, milestones, and resource workloads.
ChartPadFree
Displays a selected number of items in a Power BI bar chart and groups the remaining items as Others.
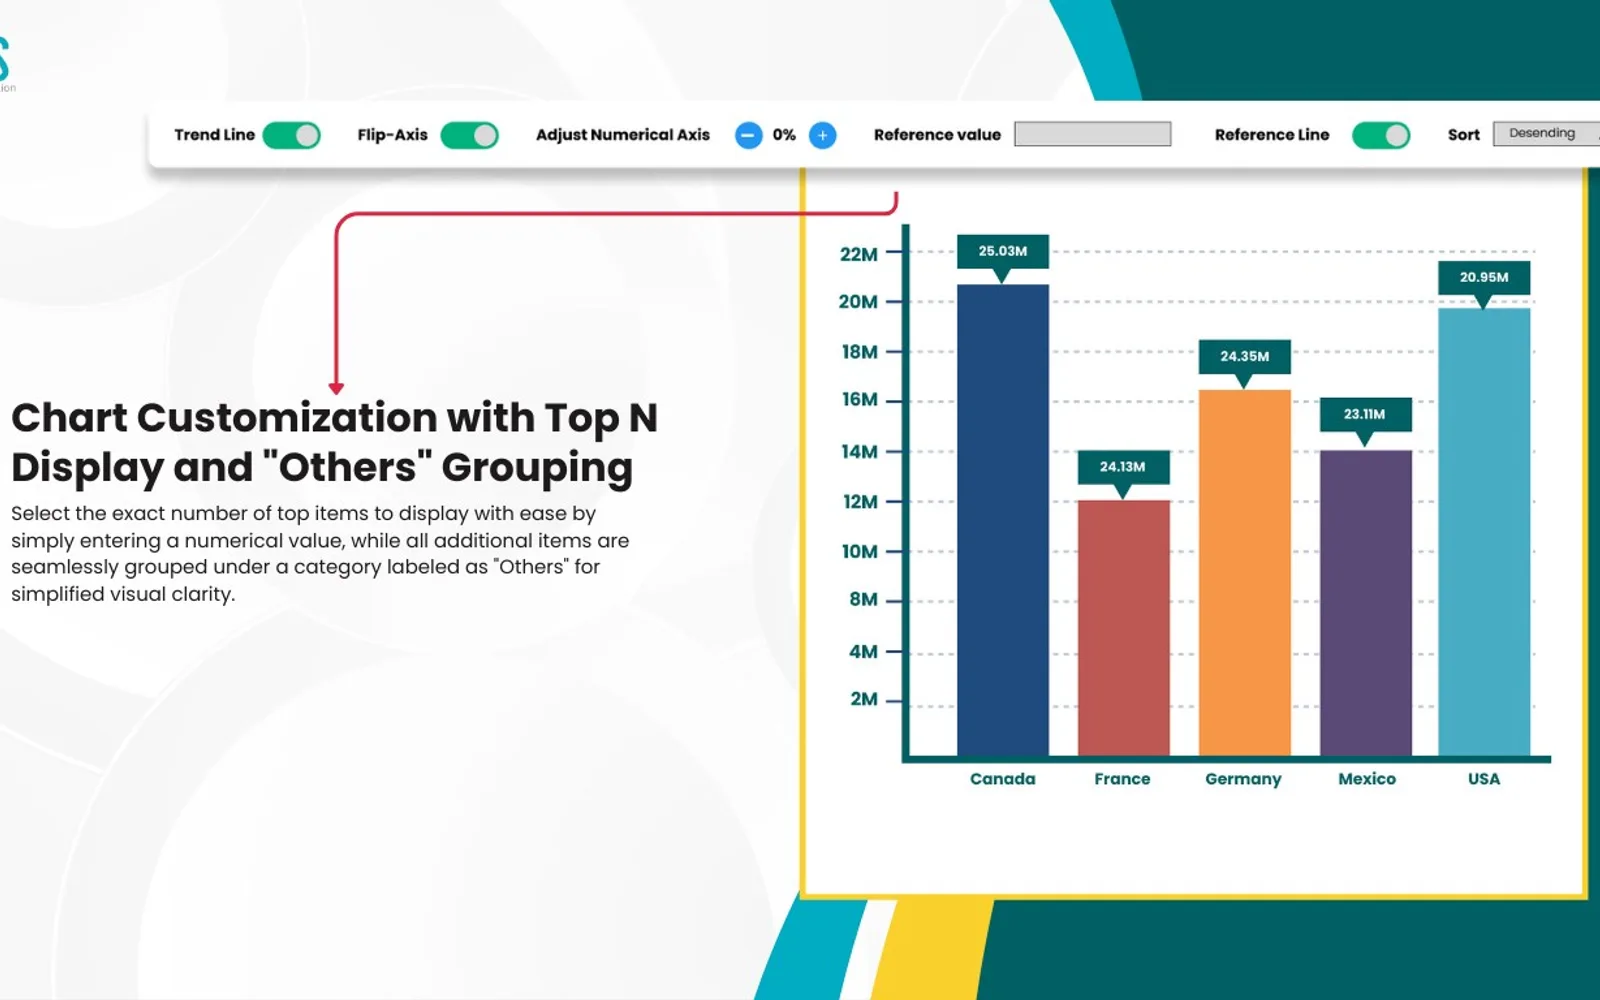
Displays a selected number of items in a bar chart and groups the remaining items under Others. The chart can switch between horizontal and vertical layouts, zoom into sections, and show selected Y-axis ranges. It can add growth trends, connectors, and reference lines. It can also compare two selected data points using sum, average, and difference statistics.
Displays the selected number of items and groups the remaining items under Others.
Switches the chart between horizontal and vertical orientations.
Zooms into specific sections of the chart.
Shows the sum, average, and difference for two selected data points.
Allows selection of the ranges displayed on the chart's Y-axis.
Adds reference lines to the chart.
2,531 plugins in Power BI · Analytics
Price distribution: 125 free, 147 freemium, 1,350 paid, 909 price not published
Gantt Chart is a project management visual for Microsoft Power BI that tracks schedules, milestones, and resource workloads.
ChartPad
Creates visualizations from diverse chart types, combines multiple charts on one canvas, and adds custom annotations and tooltips.
Akvelon
Creates financial and business reports in Power BI with automatic variance calculations, P&L logic, and drill-down (s5, s6).
Zebra BI
AI analysis app for Dynamics 365 Business Central that provides customer KPIs, churn probability, and customer grouping.
Data Courage«Chart Functionality and Key Features This chart allows users to select the Top N items to display by entering a numerical value, with the remaining items grouped under a category labeled "Others". Key Features: • Users can flip the X and Y axis - allowing the chart to rotate between vertical and horizontal …»