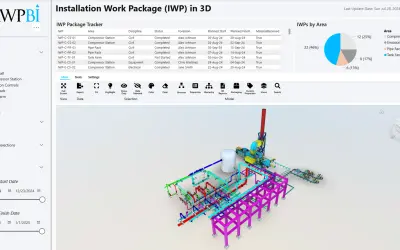
AWPBI 3D for Power BI
Power BI visual that turns a custom 3D model into a digital twin for asset monitoring, project tracking, and spatial analysis.
AWPBIFreemium
Explore imported 3D assets within interactive Power BI reports.
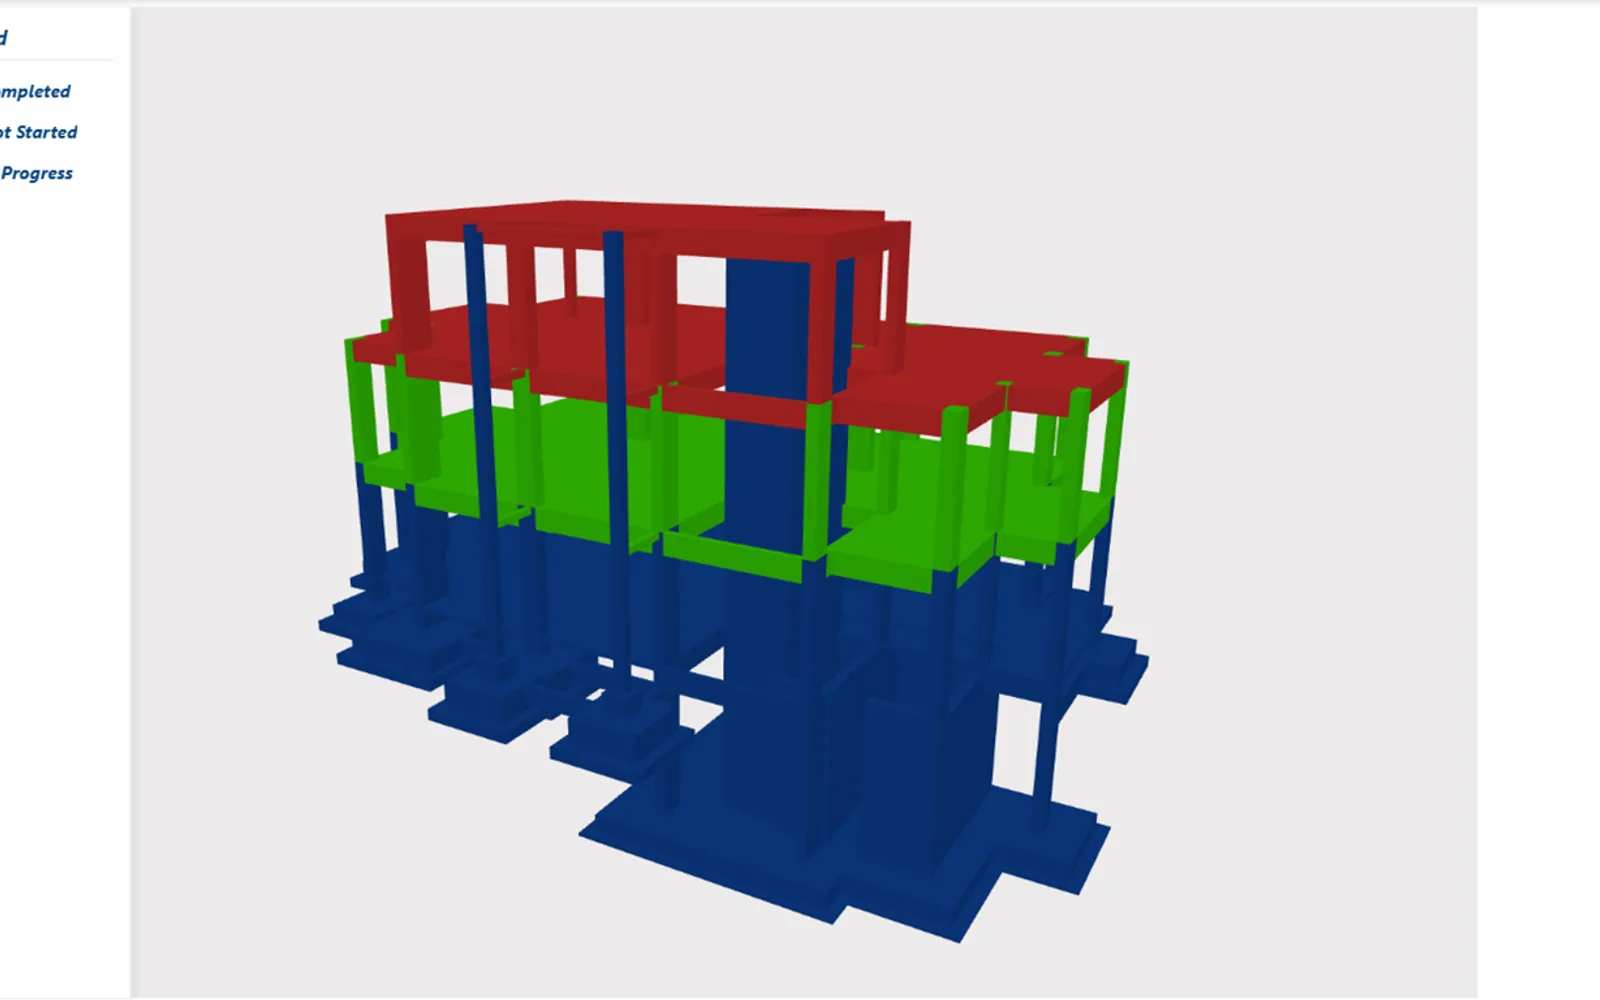
Places uploaded 3D files in Power BI and supports OBJ, STL, PLY, FBX, glTF/GLB, and IFC models. Links model element IDs and status categories with report data for highlighting, coloring, and filtering. Selections can pass between the model and tables, slicers, and other visuals. Uploaded files remain part of the report and load with each view.
Accepts OBJ, STL, PLY, FBX, glTF/GLB, and IFC model files.
Associates element IDs and status categories with individual model components.
Sends selections from model components to other visuals and from report controls back to the model.
Provides mouse or touch actions for orbiting, moving, and enlarging the model view.
Assigns colors to elements by category and displays them through a configurable legend.
Supports persistent camera positions, selected-element focus, background settings, grids, axes, and lighting.
Stores uploaded model files in the report for automatic loading during viewing.
3d-model-viewer uses a free pricing model and cloud deployment. AWPBI 3D for Power BI uses freemium pricing with cloud deployment and was updated in Jun 2026, compared with May 2026 for 3d-model-viewer. Pdf Viewer is free and cloud-deployed, with an update date of Dec 2025.
| Name | Pricing | Deployment | Updated |
|---|---|---|---|
| this plugin | Free | Cloud | |
| AWPBI 3D for Power BI | Freemium | Cloud | |
| Pdf Viewer | Free | Cloud |
657 plugins in Power BI · Analytics
Price distribution: 73 free, 108 freemium, 441 paid, 35 price not published
Power BI visual that turns a custom 3D model into a digital twin for asset monitoring, project tracking, and spatial analysis.
AWPBI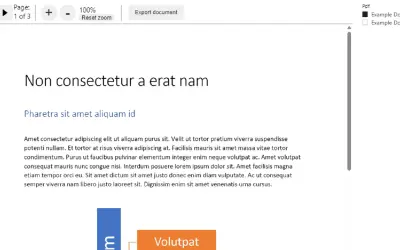
Pdf Viewer displays base64-encoded PDF documents within Power BI reports using page navigation and zoom controls.
DS Analytics AB
Gantt Chart is a project management visual for Microsoft Power BI that tracks schedules, milestones, and resource workloads.
ChartPad
Creates visualizations from diverse chart types, combines multiple charts on one canvas, and adds custom annotations and tooltips.
Akvelon«Bring 3D models into your Power BI reports with full interactivity. Upload files directly from your compute. Supported formats: OBJ, STL, PLY, FBX, glTF/GLB, and IFC. Connect your data to the visual by mapping Element IDs and status categories to highlight, color-code, and filter individual 3D elements …»