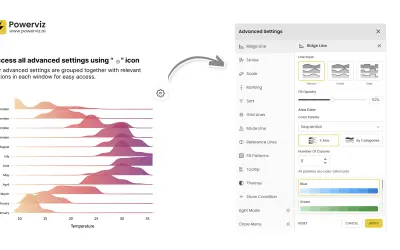
Ridgeline Plot by Powerviz
Custom Power BI visual that plots numeric distributions for multiple categories as stacked curves along a common continuous axis.
TRUVIZ INCFree
Visualizes ranking changes over time in Power BI with customizable axes, lines, markers, labels, legends, and gridlines.
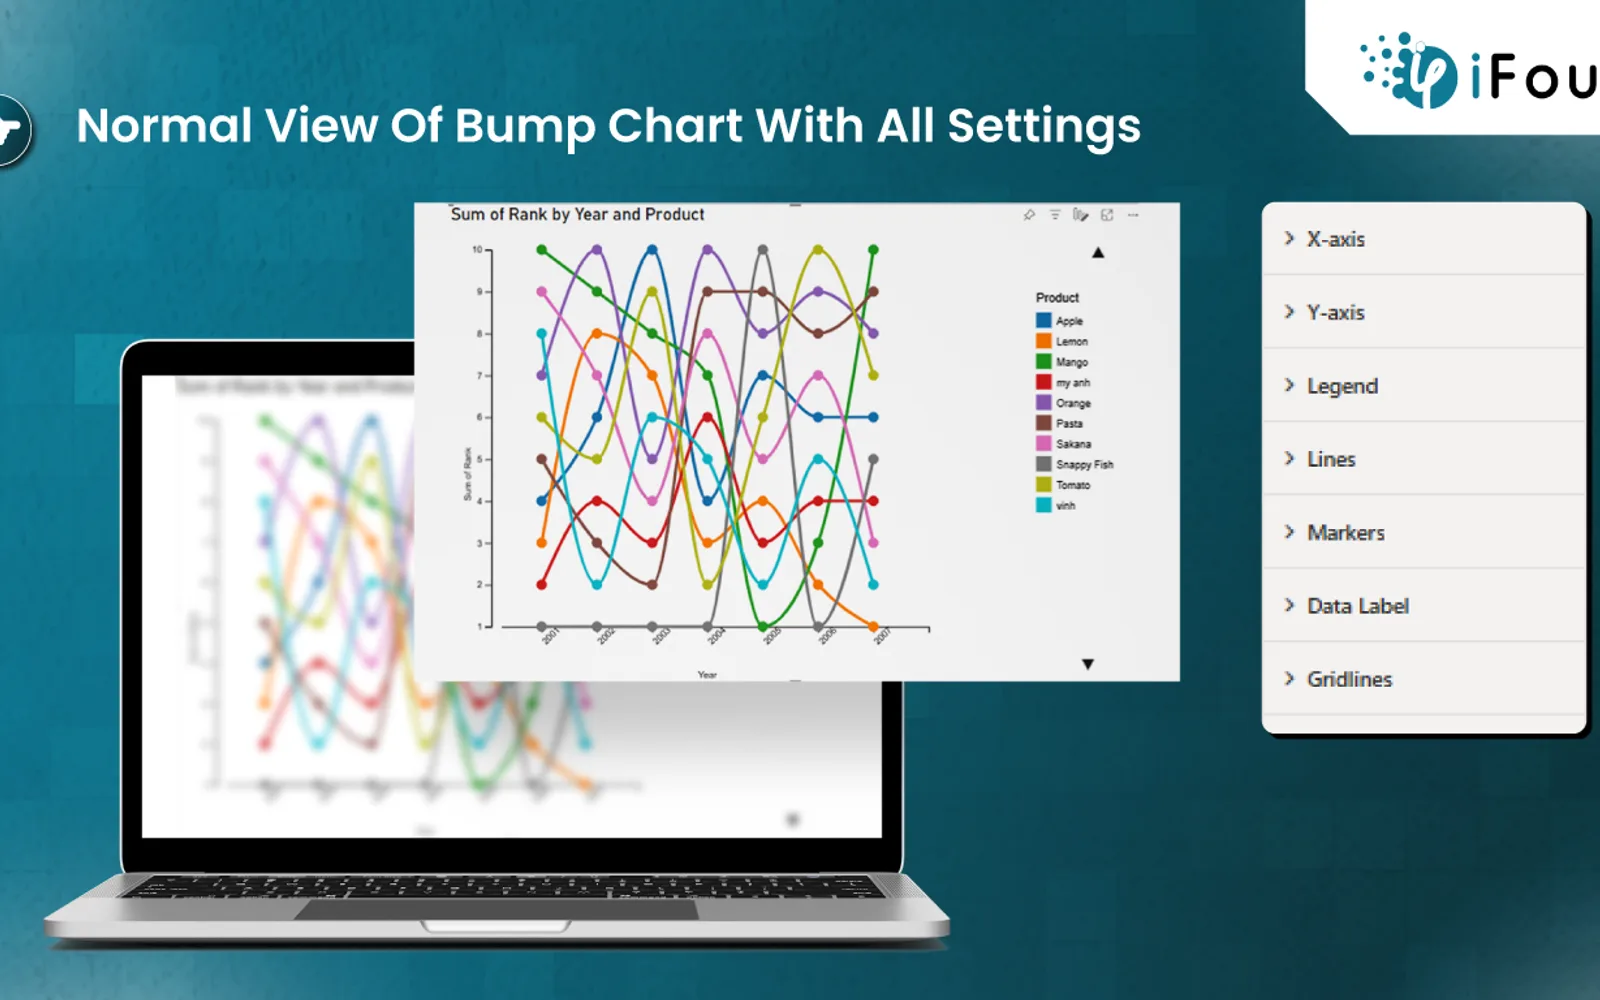
Displays how products, teams, individuals, or other entities change rank over time in Power BI. The visual supports customization of the X-axis, Y-axis, legend, lines, markers, data labels, and gridlines. Settings include font, color, thickness, marker shape and size, line style, and label or gridline visibility.
Modifies X-axis and Y-axis font settings, including size, family, and color where available.
Changes the text appearance of the chart legend.
Adjusts line thickness, colors based on data values, and solid, dashed, or dotted styles.
Selects marker shapes, sizes, and colors for data points.
Toggles data labels and customizes their font styles.
Enables or disables gridlines and changes their thickness, color, and solid or dashed style.
The vendor names HR managers, marketing teams, sports analysts, companies, and retail businesses.
BumpChart by iFour is free and cloud-deployed. Ridgeline Plot by Powerviz is also free and cloud-deployed, with an update date of Jul 2026 compared with Mar 2026 for BumpChart by iFour. Lollipop Column Chart, Performance Flow - xViz, Advanced Pie and Donut - xViz, and Bullet Chart - xViz are freemium and cloud-deployed, with update dates of Aug 2026 or Dec 2025.
| Name | Pricing | Deployment | Updated |
|---|---|---|---|
| this plugin | Free | Cloud | |
| Ridgeline Plot by Powerviz | Free | Cloud | |
| Lollipop Column Chart | Freemium | Cloud | |
| Performance Flow - xViz | Freemium | Cloud | |
| Advanced Pie and Donut - xViz | Freemium | Cloud | |
| Bullet Chart - xViz | Freemium | Cloud |
1,365 plugins in Power BI · Analytics
Price distribution: 89 free, 137 freemium, 651 paid, 488 price not published
Custom Power BI visual that plots numeric distributions for multiple categories as stacked curves along a common continuous axis.
TRUVIZ INC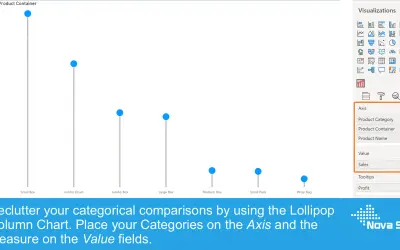
Lollipop Column Chart displays a marker and line per category as an alternative to standard column charts in Power BI.
Nova Silva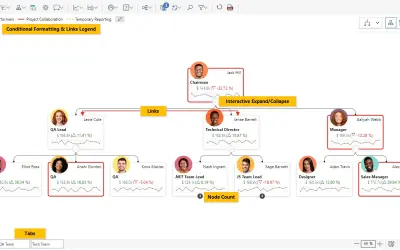
Power BI visual for tracking supply chain, sales, and financial performance with interactive diagrams, alerts, and KPIs.
xViz LLC dba Lumel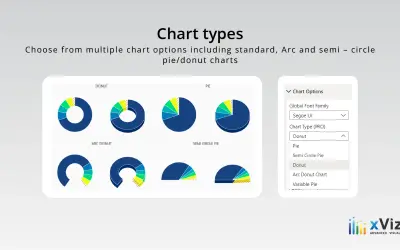
An xViz pie and donut chart for Power BI that compares parameters and displays each part's proportion of the whole.
xViz LLC dba Lumel«The Bump Chart custom visual for Power BI provides an engaging method to visualize shifts in rankings or positions over time. It is particularly effective for illustrating how entities such as products, teams, or individuals experience changes in their ranks. visual tool highlights relative changes and patterns among …»