Salesbuzz - SFA Solution for A Better Business Every Day!
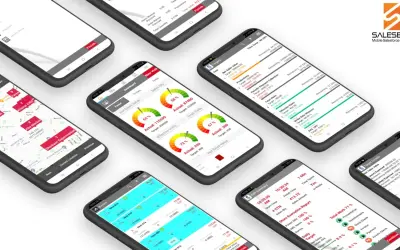
Automates and measures sales operations and sales force activities with real-time insights for Microsoft Dynamics 365.
BI-TechnologiesPaidCompare
2531 analytics apps for Microsoft 365
Automates and measures sales operations and sales force activities with real-time insights for Microsoft Dynamics 365.
BI-Technologies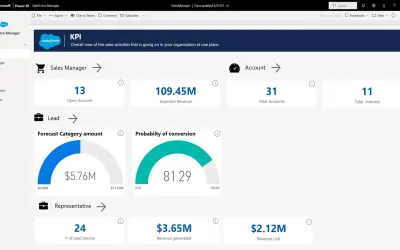
This Salesforce template app for Power BI provides an out-of-box dashboard of sales pipeline, best accounts, and KPI metrics.
Microsoft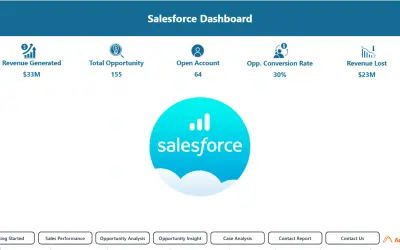
Salesforce Insight App provides sales, opportunity, case, and contact reporting within Microsoft Power BI Desktop or Service.
Addend Analytics LLP
Embeds Salesforce data in SharePoint as a web part or Viva Connections dashboard card, with search for Salesforce records.
adenin TECHNOLOGIES Inc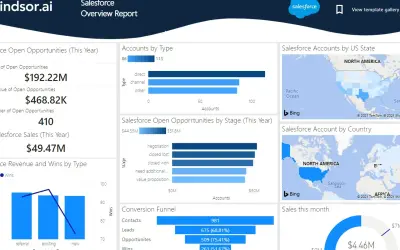
Pulls Salesforce Account, Lead, Contact, Task, Opportunity, and Campaign data into a three-page Power BI report template.
Windsor.ai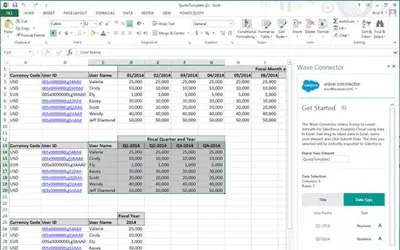
Creates datasets in Salesforce Analytics Cloud from Excel worksheet data, without complex data mapping or schema creation.
salesforce.com
Sally Suite provides AI-assisted writing, data analysis, and presentation tools as an add-in for Word, Excel, and PowerPoint.
深圳市识途管理咨询有限公司An AI add-in for Word, Excel, and PowerPoint that supports document writing, spreadsheet analysis, and slide creation.
深圳市识途管理咨询有限公司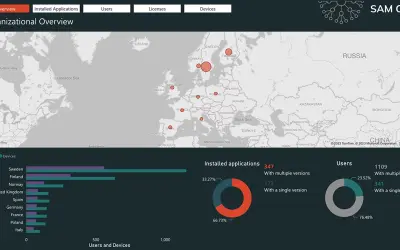
SAM One generates a consolidated report covering devices, licenses, and applications based on Microsoft Intune and Azure data.
Edgeguide AB
Sana app that delivers notifications about assignments, live sessions, mentions, comments, and dashboards in Microsoft Teams.
Sana Labs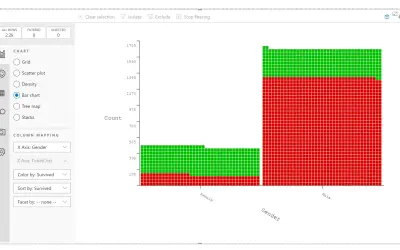
SandDance visualizes data with one-to-one row-to-mark unit visualizations and can be embedded into custom applications.
Microsoft Corporation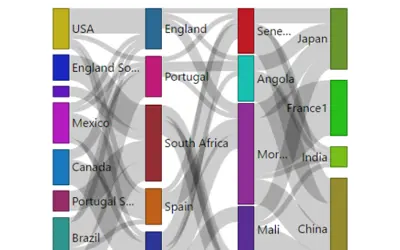
Sankey Chart visualizes flow sources, destinations, and intermediate steps with cross-filtering support for Power BI.
Microsoft Corporation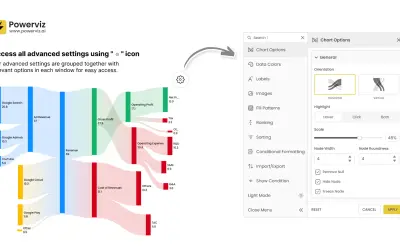
Sankey Chart by Powerviz provides multi-level vertical and horizontal charts with ranking, sorting, and conditional formatting.
TRUVIZ INC
Creates Sankey diagrams with up to 12 levels in Microsoft Power BI, with customizable nodes, flows, colors, and text.
VisioChart
Sankey Diagram by ChartExpo renders multi-step flow visualizations for money, users, and materials directly inside Power BI.
polyvista.com
Purpose-built Excel add-in for generating Sankey diagrams, plots, and alluvial charts with up to 8 levels and no coding.
polyvista.com
Creates Sankey diagrams in Microsoft Excel and PowerPoint, with adjustable nodes, flows, statistics, text, and colors.
VisioChart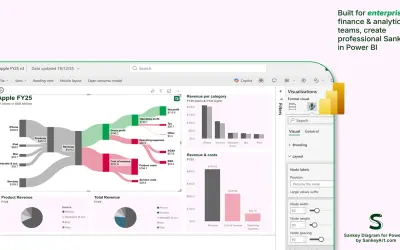
This Microsoft-certified Power BI visual creates Sankey diagrams of P&L statements, cash flows, sales, and cost breakdowns.
SankeyArt
ChartExpo Sankey Diagram visualizes multi-level data flows like money, people, and resources directly inside Power BI.
polyvista.com
Excel add-in that connects SAP Analytics Cloud models, SAP Datasphere, and S/4HANA Cloud data for ad-hoc reporting and planning.
SAP SE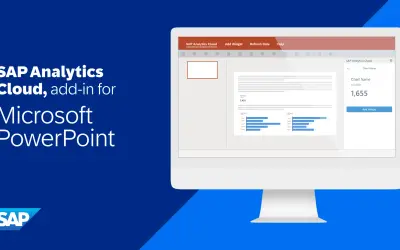
Embeds SAP Analytics Cloud widgets into Microsoft PowerPoint slides and refreshes their data on demand without copy/paste.
SAP SE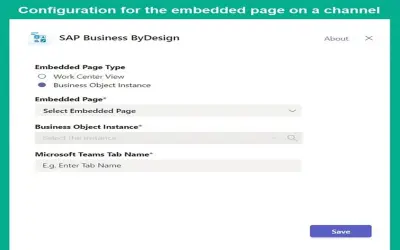
Access SAP Business ByDesign features, work lists, and analytics directly within Microsoft Teams channels.
SAP SE