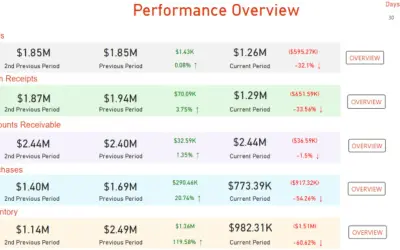
Performance Overview
Provides five reports on Sales, Cash Receipts, Accounts Receivable, Purchases, and Inventory, plus a dashboard of report totals.
Navisiontech, IncPaidCompare
2531 analytics apps for Microsoft 365
Provides five reports on Sales, Cash Receipts, Accounts Receivable, Purchases, and Inventory, plus a dashboard of report totals.
Navisiontech, Inc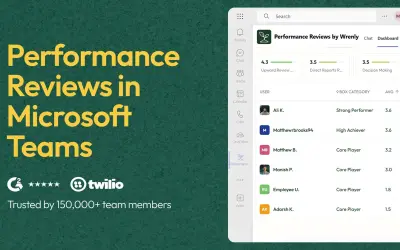
Performance Reviews by Wrenly manages 360-degree feedback cycles, analytics, and calibration inside Microsoft Teams.
Incognito Apps Inc.
Personal dashboard by adenin aggregates live data from external apps into Adaptive Cards displayed on SharePoint intranet pages.
adenin TECHNOLOGIES Inc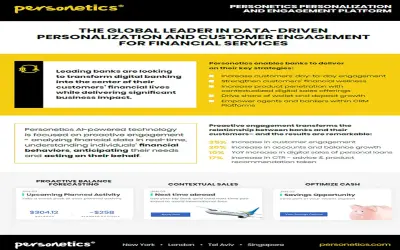
Personetics Engagement Platform provides banks with AI that analyzes financial data in real time to engage customers proactively.
Personetics Technologies LTD.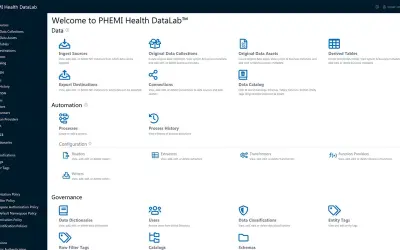
PHEMI Health DataLab ingests, de-identifies, and governs healthcare data, enabling responsible sharing of PHI for research.
PHEMI Systems Corporation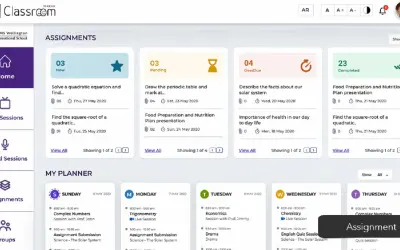
Phoenix provides K-12 schools with student management, classroom learning, and incident reporting tools in a single platform.
GEMS GROUP HOLDINGS LIMITED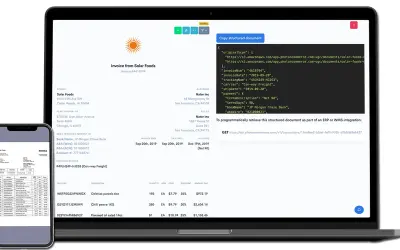
Extracts line items and SKUs from invoices, receipts, and packing lists and imports the data to Quickbooks or a spreadsheet.
Photon Commerce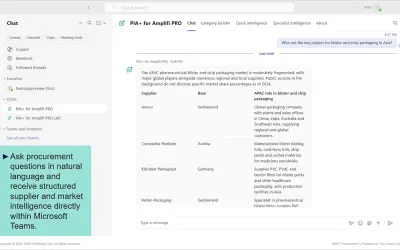
This Gen AI assistant gives Amplifi PRO users faster access to category, commodity, and supplier market intelligence.
WNS Global Services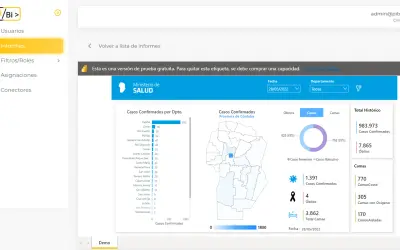
PiBi is a SaaS portal that distributes embedded Power BI reports via an Azure bridge using capacity-based licensing.
Pi Data Strategy & Consulting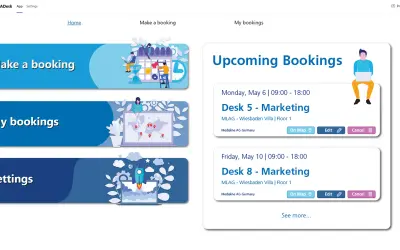
Book workspaces, rooms, parking, and equipment in Microsoft Teams with a calendar-based tool that signs users in automatically.
Medialine EuroTrade AG
Pickit Business is a DAM system for Microsoft 365 that stores, organizes, and distributes digital assets across an organization.
Pickit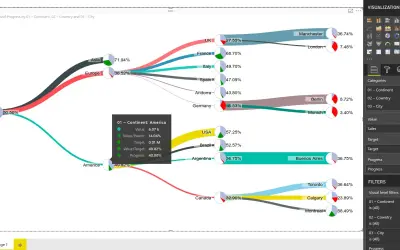
Pie Charts Tree is a visual component that displays category trees with pie chart values in each node for Power BI.
Aritz Francoy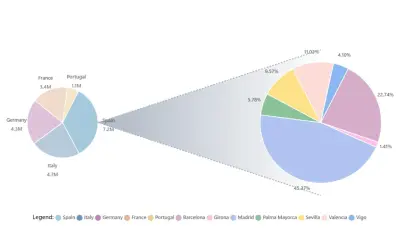
A Power BI custom visual that creates interactive hierarchical pie charts with clickable slices to reveal deeper data layers.
JTA The Data Scientists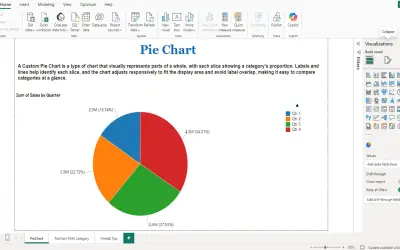
PieChart by iFour divides data into colored slices to visualize parts-to-whole relationships within Power BI reports.
iFour Technolab Pvt. Ltd.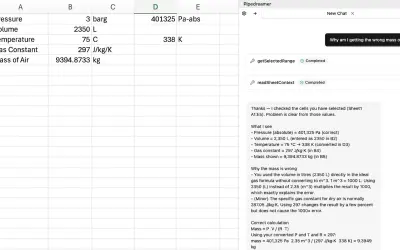
Pipedreamer AI executes formulas, scripts, and automation directly inside spreadsheet files based on plain English prompts.
Pipedreamer, Inc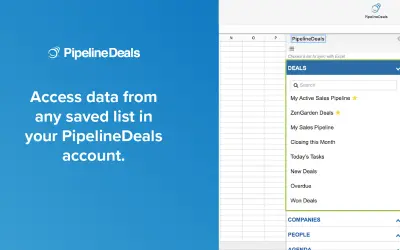
PipelineDeals Data Sync manages and refreshes sales and marketing data between PipelineDeals and Microsoft Excel.
PipelineDeals Inc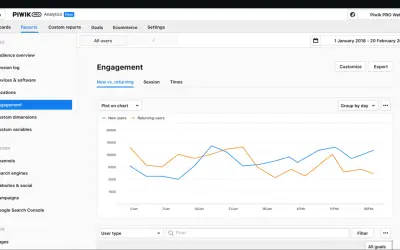
Piwik PRO Analytics Suite analyzes customer journeys across websites and apps while maintaining data privacy compliance.
Piwik PRO SA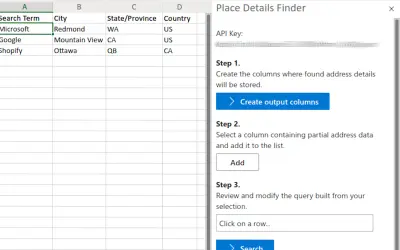
Place Details Finder retrieves place name, address, phone, website, latitude, and longitude from partial address info in Excel.
Nils Loewen
PlanIt provides dynamic annual planning with visual activity tracking for Microsoft Teams, Planner, and Outlook environments.
Enable 365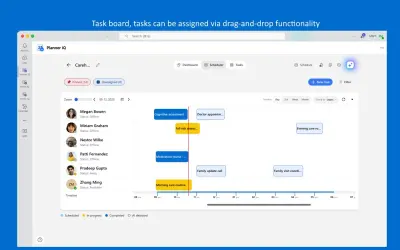
PlannerIQ is an intelligent project management app that integrates with Microsoft Planner and Microsoft Teams.
AiCarpus s. r. o.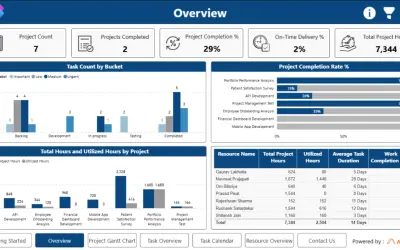
Connects Microsoft Planner data to Power BI to provide a governed dashboard of tasks, timelines, and workload metrics.
Addend Analytics LLP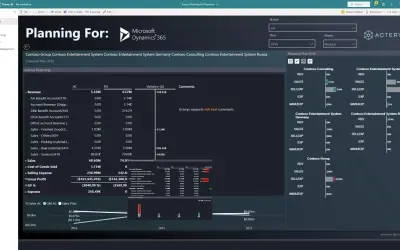
Acterys delivers financial planning, analytics, and reporting templates for Dynamics, Power BI, and Excel environments.
Managility