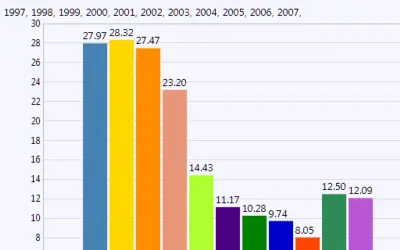
BlackCompass Visualizer for SharePoint
Enables business users to visualize SharePoint lists and document libraries with dashboards and KPI column-style visuals.
BlackCompass SoftwarePrice not published
Displays live data from connected business applications in customizable dashboards for SharePoint pages.
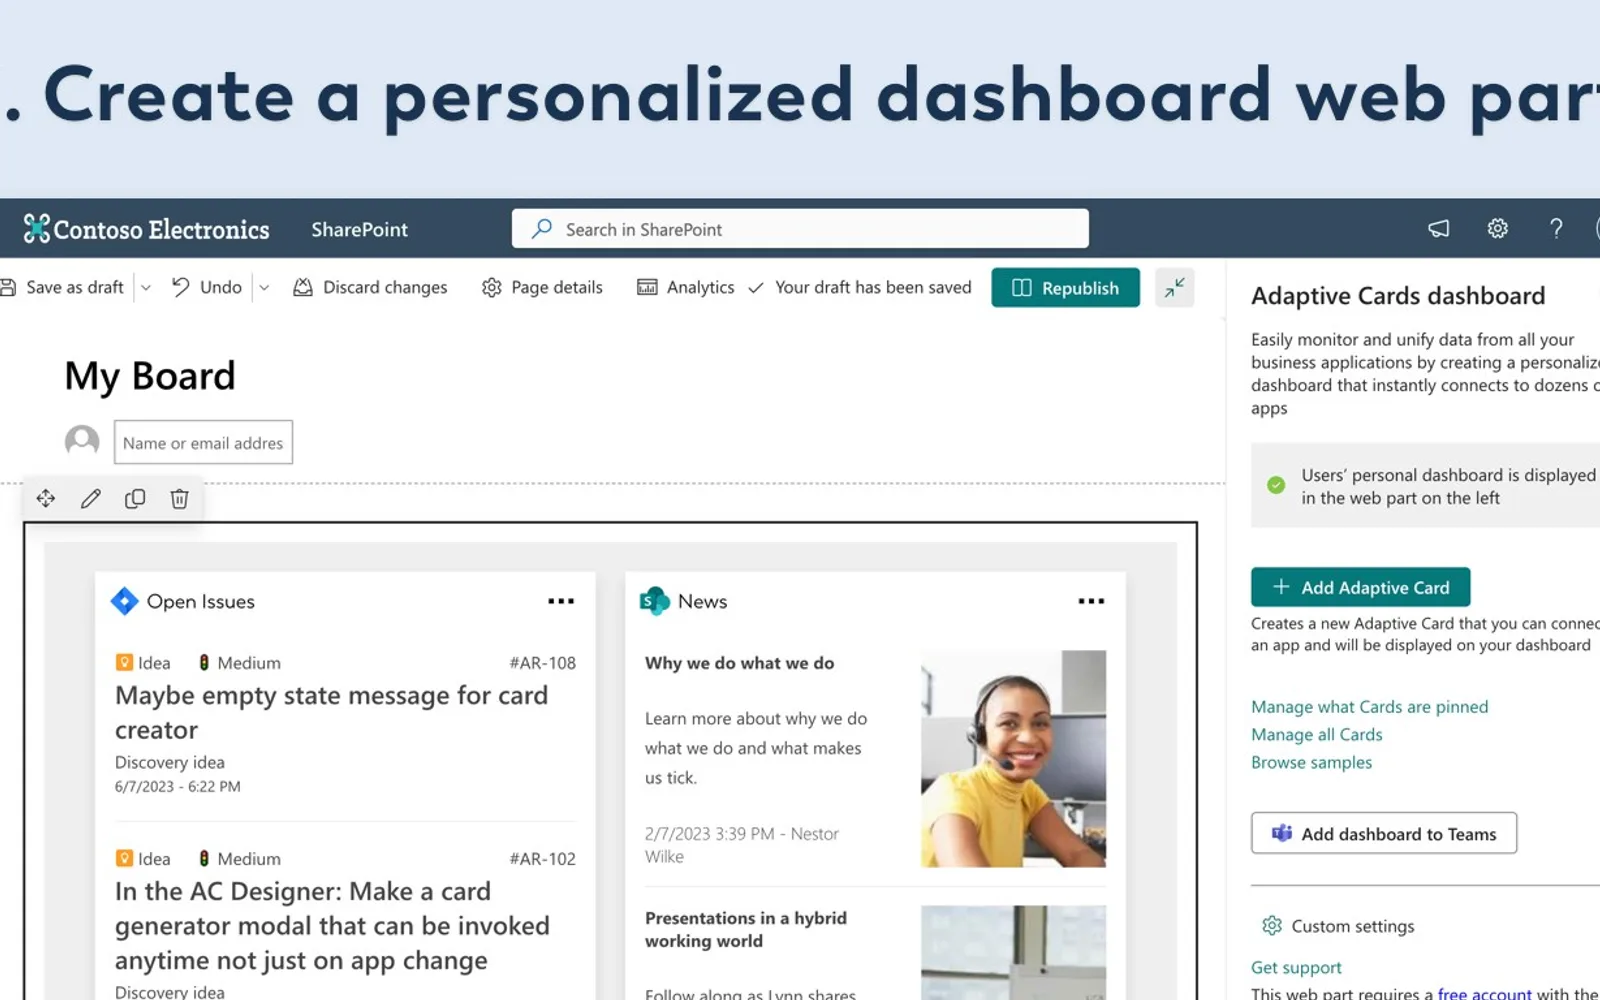
Adds a web part to SharePoint pages for displaying information from connected applications. Users select an application and data source, then authenticate the connection before adding a card to the dashboard. Cards use the Adaptive Card format and can be modified with the built-in low-code designer. The listing states that data is fetched from the connected source application when displayed.
Connects with applications including ServiceNow, HubSpot, Salesforce, Jira, GitHub, and Zendesk.
Displays connected application data as Adaptive Cards on SharePoint pages.
Allows card layouts to be modified with a built-in low-code designer.
Filters received data using criteria and Microsoft Adaptive Expressions.
Restricts who can view individual Adaptive Cards.
Tracks usage metrics and records API requests with possible error codes.
The listing names administrators, employees, SharePoint users, and developers.
Personal dashboard by adenin and Business Charts both use cloud deployment and have unknown pricing. BlackCompass Visualizer for SharePoint also uses cloud deployment with unknown pricing; its listed update date is Apr 2022, while this listing was updated on Nov 2023. HR Reporting and Analytics- Power BI Dashboard and Funnel Charts use cloud deployment with paid pricing, while this listing has unknown pricing.
| Name | Pricing | Deployment | Updated |
|---|---|---|---|
| this plugin | Price not published | Cloud | |
| Business Charts | Not in catalog | ||
| BlackCompass Visualizer for SharePoint | Price not published | Cloud | |
| HR Reporting and Analytics- Power BI Dashboard | Paid | Cloud | |
| Funnel Charts | Paid | Cloud | |
1,049 plugins in SharePoint · Analytics
Price distribution: 29 free, 79 freemium, 381 paid, 560 price not published
Enables business users to visualize SharePoint lists and document libraries with dashboards and KPI column-style visuals.
BlackCompass Software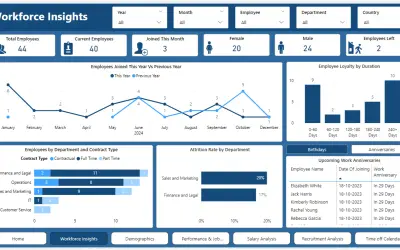
Power BI dashboard with real-time views of HR metrics such as headcount, attrition, recruitment, compensation, and leave.
Addend Analytics LLP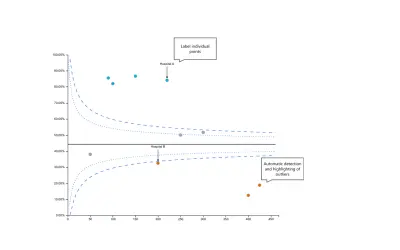
Builds no-code funnel plots for Power BI, covering proportions and ratios of counts, with export to PDF and PowerPoint.
Government of Western Australia - Department of Health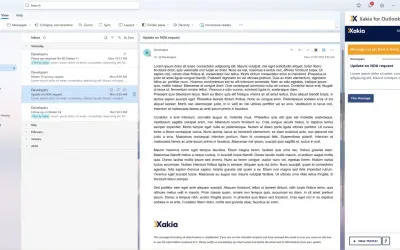
Microsoft Outlook add-in for Xakia that creates matters from email content, updates matter status, and files email threads.
Xakia Technologies«Easily create an aggregated view of all your external business apps by simply connecting your dashboard to popular applications such as ServiceNow, HubSpot, Salesforce, Jira, Github, Zendesk and many others. See all compatible apps → Having one view that’s always in-sync helps employees cut down on time wasted hunting …»