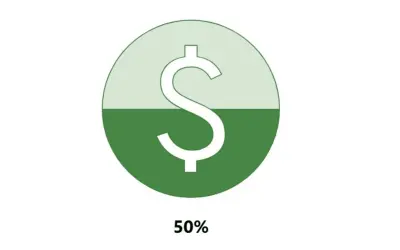
Progress Icon
Power BI custom visual that fills an SVG icon to show KPI progress toward a target instead of a plain number on a card.
NeenOpal IncPaid
Display customizable KPI values and series names in Power BI reports.
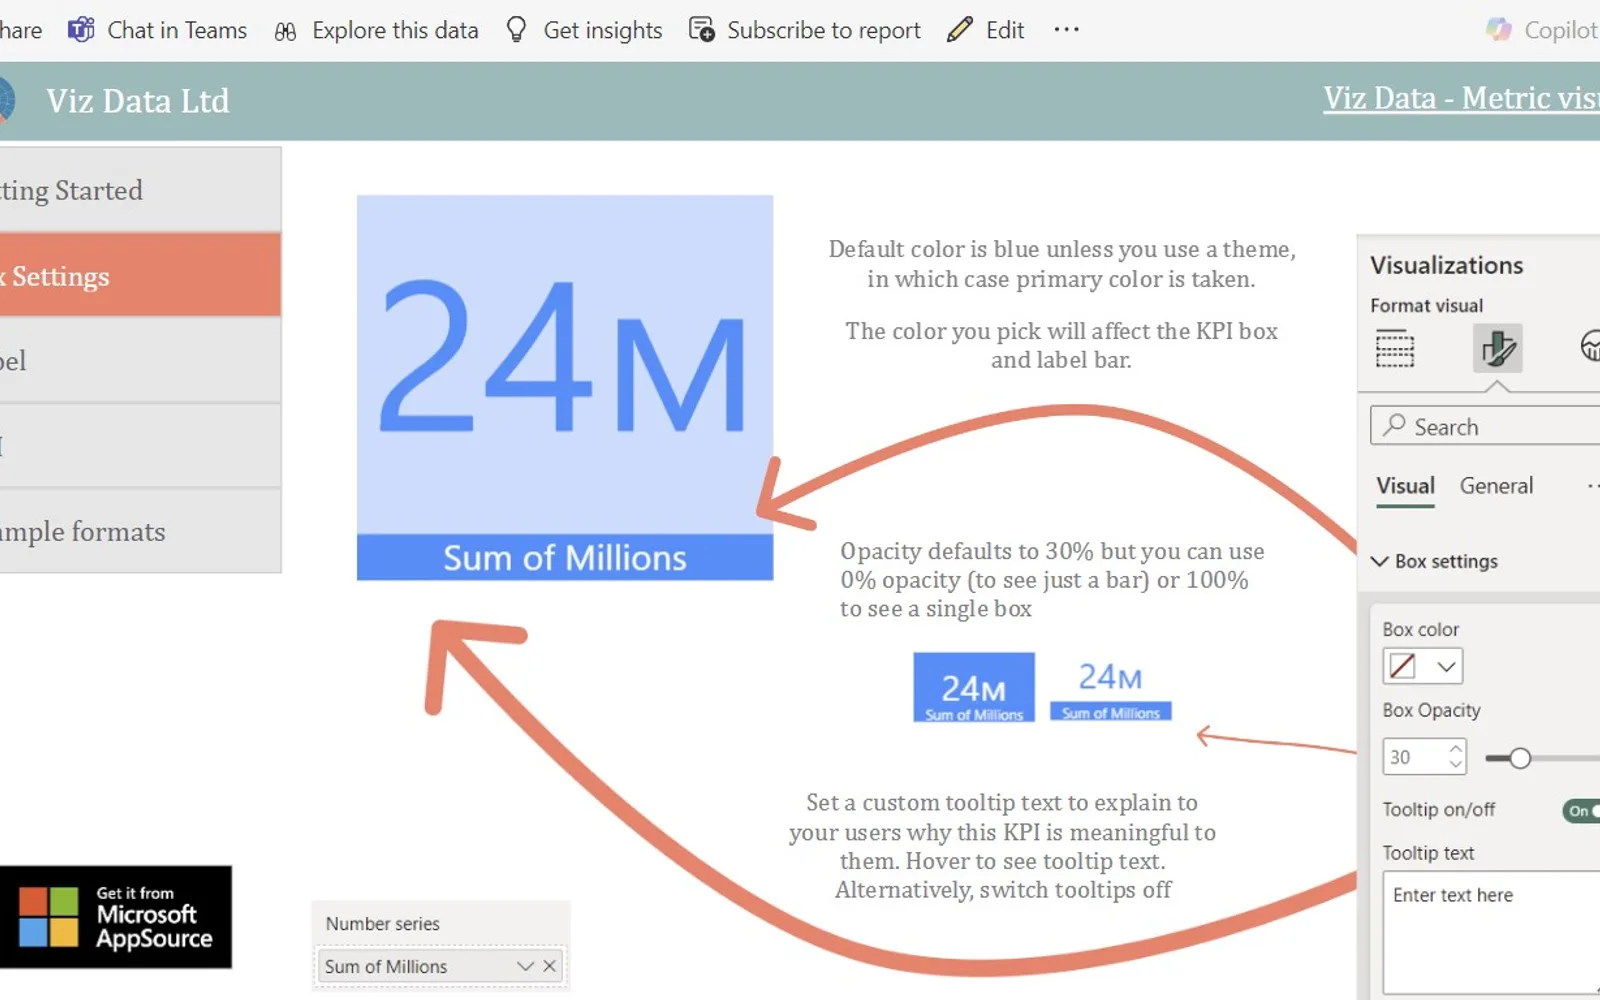
Metric displays KPI values and series names in Power BI reports using transparent, colored, or combined boxes. It supports custom units, divisors, decimal places, alignment, colors, transparency, and formatting. It can inherit Power BI theme colors, accept explanatory tooltips without a data series, and hide the series name in minimalist mode. Metric is available as a free .pbiviz download, with a one-month free trial available through the subscription option.
Values can use thousands, millions, or trillions through a custom divisor or automatic abbreviation.
The KPI and series name can use an underline, transparent overlay, or combined box format.
The KPI and series name can be positioned and aligned in different locations.
The visual inherits Power BI theme colors and allows color overrides when no theme is detected.
The visual recognizes financial formats, decimal places, and display units.
An explanatory tooltip can be added in the formatting pane without a data series.
The series name can be hidden and the KPI box made transparent for an underline-style display.
Metric is free and cloud-deployed, while Progress Icon is paid and cloud-deployed. Metric was updated on Dec 2025, while Progress Icon was updated in May 2026.
| Name | Pricing | Deployment | Updated |
|---|---|---|---|
| this plugin | Free | Cloud | |
| Progress Icon | Paid | Cloud |
744 plugins in Power BI · Analytics
Price distribution: 74 free, 110 freemium, 451 paid, 109 price not published
Power BI custom visual that fills an SVG icon to show KPI progress toward a target instead of a plain number on a card.
NeenOpal Inc
Gantt Chart is a project management visual for Microsoft Power BI that tracks schedules, milestones, and resource workloads.
ChartPad
Creates visualizations from diverse chart types, combines multiple charts on one canvas, and adds custom annotations and tooltips.
Akvelon
Creates financial and business reports in Power BI with automatic variance calculations, P&L logic, and drill-down (s5, s6).
Zebra BI«Showcase your KPIs with an intelligent and customizable display Metric is a simple yet powerful way to display key performance indicators (KPIs) in your Power BI reports. Designed for clarity and customization, Metric presents your KPI in a transparent or colored box, with its series name in a matching opaque box. The …»