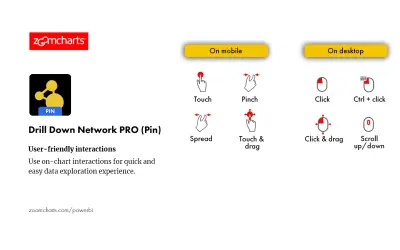
Drill Down Network PRO (Pin) by ZoomCharts
Drill Down Network PRO (Pin) by ZoomCharts renders interactive category-based network charts with drill-down support in Power BI.
ZoomChartsFreemium
Visualizes relationship networks in Power BI with repeatable layouts, graph analysis, filters, search, and report interactions.
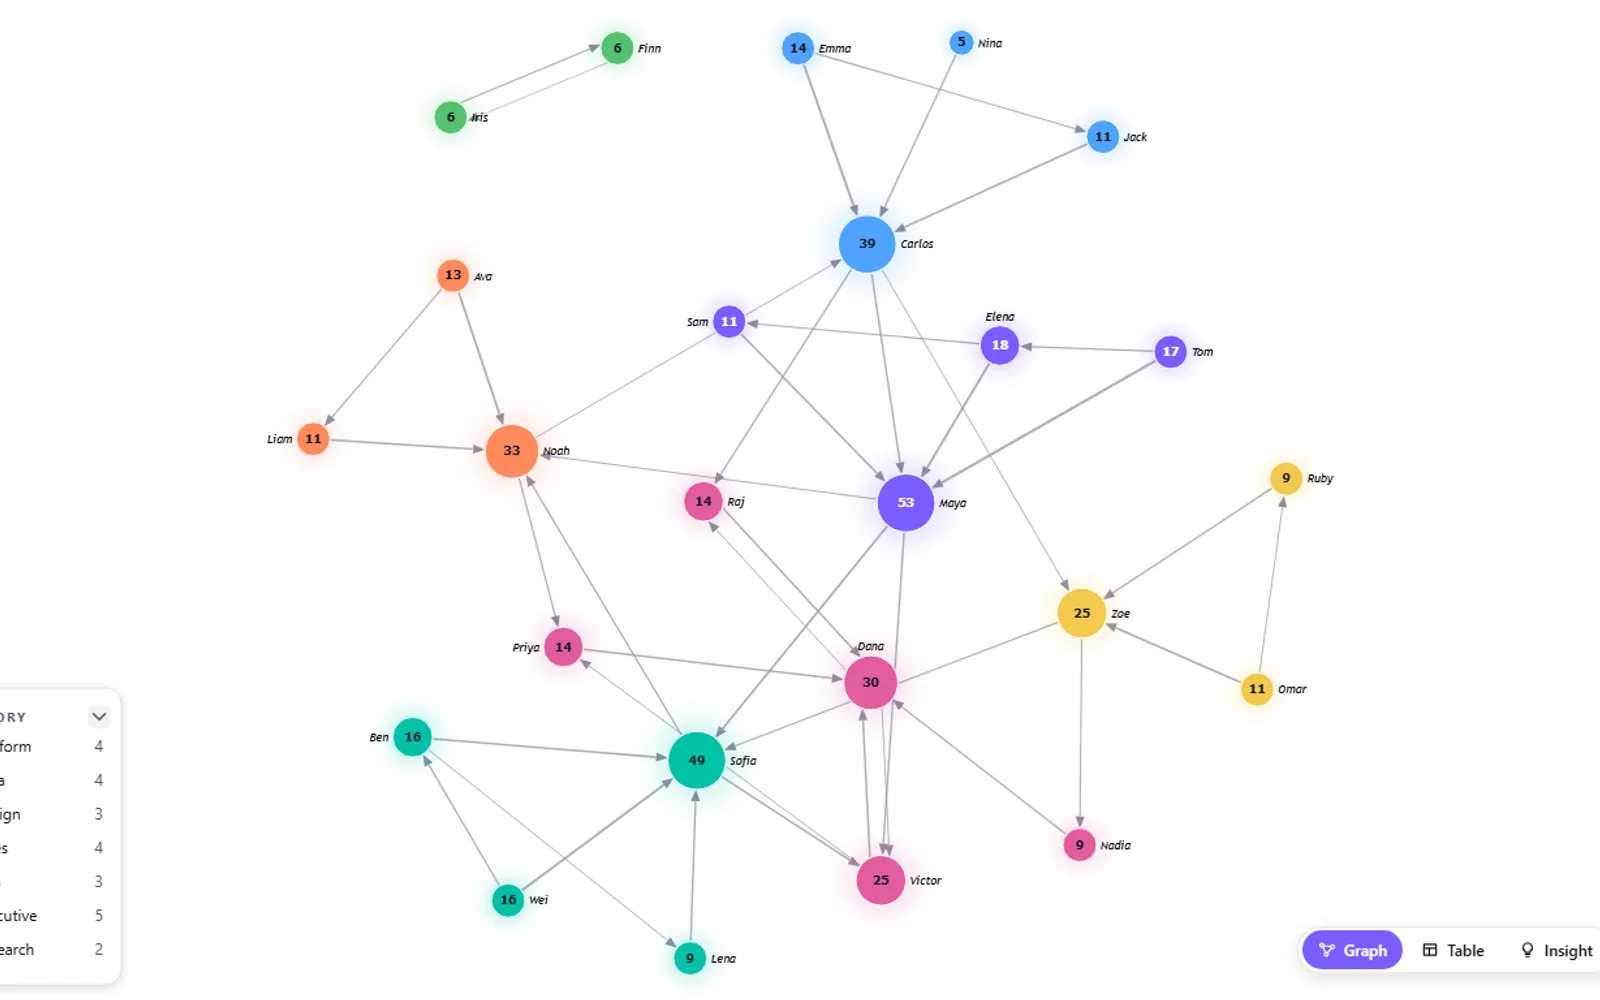
Displays connected data in Power BI after Source and Target fields are assigned. Additional bindings can represent weights, categories, sizes, parent-child links, images, and time. Layout choices include force, concentric, circular, grid, and tree views, while paid tiers add network metrics, community analysis, path finding, and time or geographic views. The visual operates within the Power BI sandbox without network requests, external data, or telemetry.
Calculates node locations from the data so repeated refreshes preserve the same arrangement.
Includes force, concentric, circular, grid, and tree or organization-chart modes.
Pro adds degree, betweenness, closeness, and PageRank calculations for node sizing, colouring, and ranking.
Supports cross-filtering, multiple selection, hover emphasis, tooltips, labels, legends, and node lookup.
Enterprise adds community detection, group hulls, neighbour expansion, and shortest-path analysis.
Enterprise includes a canvas renderer and minimap for graphs with no stated node-count ceiling.
Zentrix Network Graph has a free price type, while Drill Down Network PRO (Pin) by ZoomCharts, Performance Flow - xViz, Sunburst Chart, Funnel/Pyramid Chart - xViz, and Bullet Chart - xViz have freemium price types. Zentrix Network Graph and all listed alternatives use cloud deployment. Zentrix Network Graph and Drill Down Network PRO (Pin) by ZoomCharts show an update month of Aug 2026, while the other listed alternatives show Dec 2025.
| Name | Pricing | Deployment | Updated |
|---|---|---|---|
| this plugin | Free | Cloud | |
| Drill Down Network PRO (Pin) by ZoomCharts | Freemium | Cloud | |
| Performance Flow - xViz | Freemium | Cloud | |
| Sunburst Chart | Freemium | Cloud | |
| Funnel/Pyramid Chart - xViz | Freemium | Cloud | |
| Bullet Chart - xViz | Freemium | Cloud |
657 plugins in Power BI · Analytics
Price distribution: 73 free, 108 freemium, 441 paid, 35 price not published
Drill Down Network PRO (Pin) by ZoomCharts renders interactive category-based network charts with drill-down support in Power BI.
ZoomCharts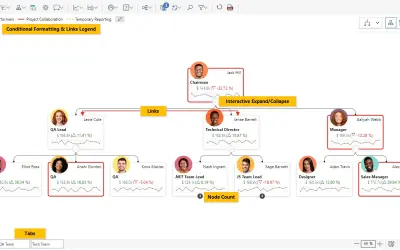
Power BI visual for tracking supply chain, sales, and financial performance with interactive diagrams, alerts, and KPIs.
xViz LLC dba Lumel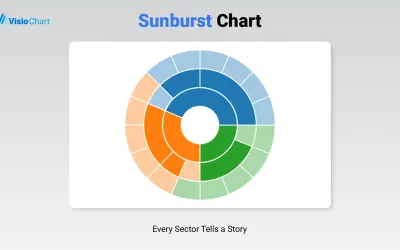
Displays up to five levels of hierarchical data as proportional segments across concentric rings in Power BI reports.
VisioChart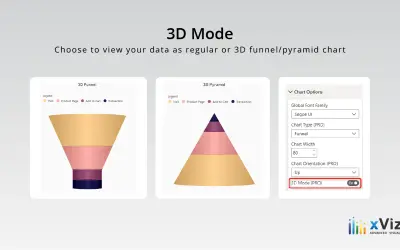
xViz Funnel/Pyramid Chart displays process stages and hierarchies with configurable 2D or 3D views for Power BI reports.
xViz LLC dba Lumel«A network graph that stays put. Most force-directed graphs re-solve their layout every time the data refreshes, so the picture you arranged yesterday is gone this morning. Zentrix Network Graph seeds positions from the data itself, not a random number, so the same data always lands in the same place — stable across …»