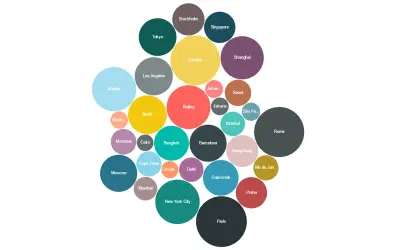
Bubble Chart by Akvelon
Bubble Chart by Akvelon is a Power BI visual that packs bubbles tightly to display more categories in a given space.
AkvelonPaid
Uses two measures in a Power BI donut-style visual to compare category magnitude and proportion.
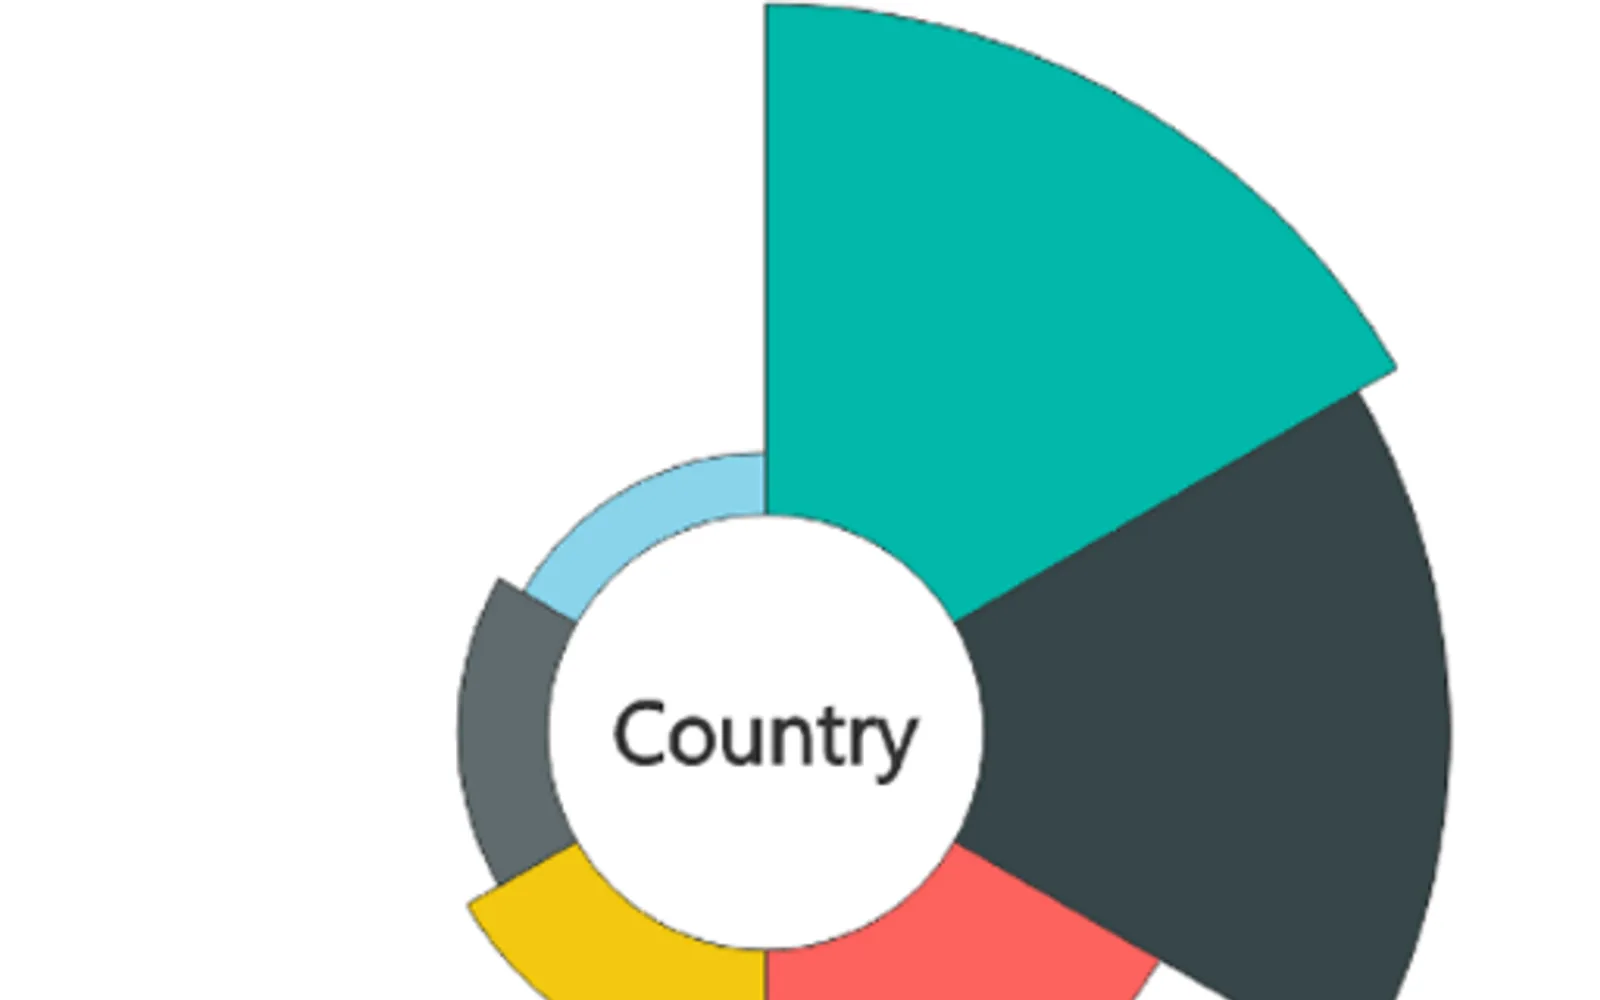
Combines a donut-chart layout with two measures. Dataset categories define the slices. One measure controls slice radius, while the other controls sweep angle. This shows magnitude and proportion in the same visual.
Each slice represents a category from the dataset.
The visual uses two separate measures in its layout.
The first measure determines the radius of each slice.
The second measure controls the sweep angle of each slice.
Aster Plot, Bubble Chart by Akvelon, and Box and Whisker chart are all paid and cloud-deployed. Aster Plot was updated on Jun 2025, while Bubble Chart by Akvelon and Box and Whisker chart show Sep 2025.
| Name | Pricing | Deployment | Updated |
|---|---|---|---|
| this plugin | Paid | Cloud | |
| Bubble Chart by Akvelon | Paid | Cloud | |
| Box and Whisker chart | Paid | Cloud |
51 plugins in GitHub · Analytics
Price distribution: 1 free, 2 freemium, 42 paid, 6 price not published
Bubble Chart by Akvelon is a Power BI visual that packs bubbles tightly to display more categories in a given space.
Akvelon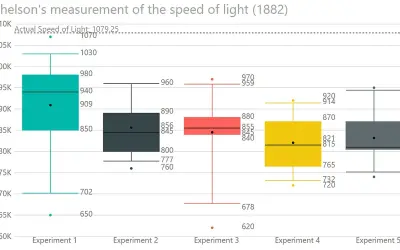
Displays the five-number summary of numerical datasets in Power BI, showing quartiles, median, mean, and whiskers.
DataScenarios
Gantt Chart is a project management visual for Microsoft Power BI that tracks schedules, milestones, and resource workloads.
ChartPad
Creates visualizations from diverse chart types, combines multiple charts on one canvas, and adds custom annotations and tooltips.
Akvelon«The Aster Plot is a custom visual that combines the familiar look of a donut chart with added analytical depth by incorporating two separate measures. This unique design enables a more nuanced representation of data, making it ideal for comparative analysis and insightful storytelling. • Category-driven layout: Each …»