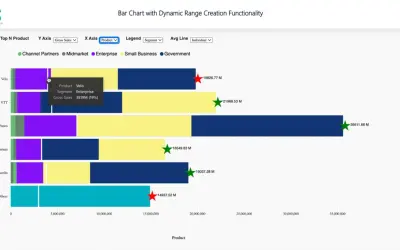
Bar Chart with Dynamic Range Creation
Bar Chart with Dynamic Range Creation for Power BI lets business users define X-Axis buckets and change axes dynamically.
Office Solution AI LabsPaidCompare
10 apps
Bar Chart with Dynamic Range Creation for Power BI lets business users define X-Axis buckets and change axes dynamically.
Office Solution AI Labs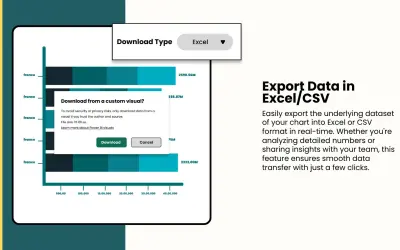
Bar Chart with Export Data Feature for Power BI lets business users export chart data and adjust axes dynamically.
Office Solution AI Labs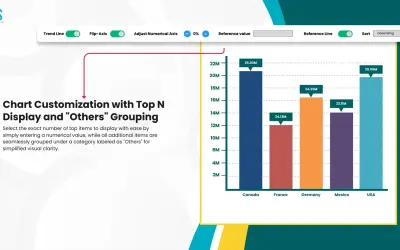
Custom bar chart from Innovational Office Solution that displays a chosen number of top items and groups the rest as Others.
Office Solution AI Labs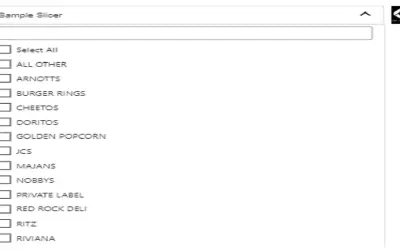
Custom slicer for Power BI providing measure-based dropdown sorting, Top N, fixed elements, and item count control.
Office Solution AI Labs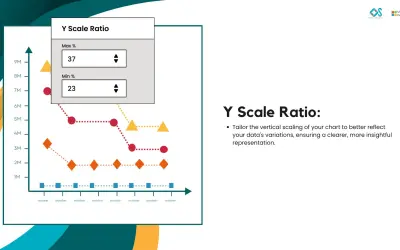
Combines line and bubble elements to display trends and variable relationships in Power BI by Office Solution.
Office Solution AI Labs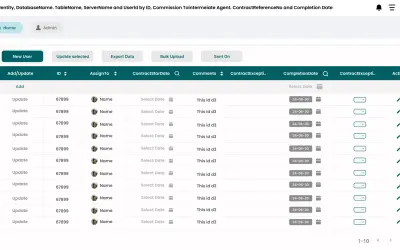
Power BI enterprise solution combining writeback, report bursting, machine learning, and approval workflow features.
Office Solution AI Labs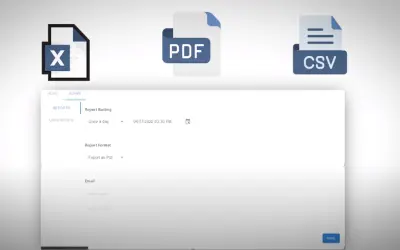
Schedules Power BI report bursting in PDF, Excel, or CSV with conditional formatting, RLS, and event-based triggers.
Office Solution AI Labs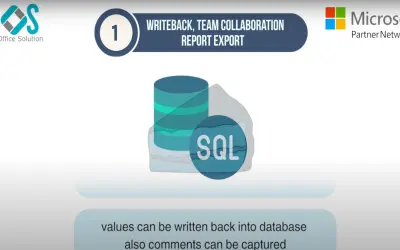
Enables database write-back, Teams and email messaging, and report export directly from Power BI visuals.
Office Solution AI Labs