
Gantt Chart
Gantt Chart is a project management visual for Microsoft Power BI that tracks schedules, milestones, and resource workloads.
ChartPadFree
Combines line and bubble charts in Power BI to show trends, relationships, and numerical values through bubble size.
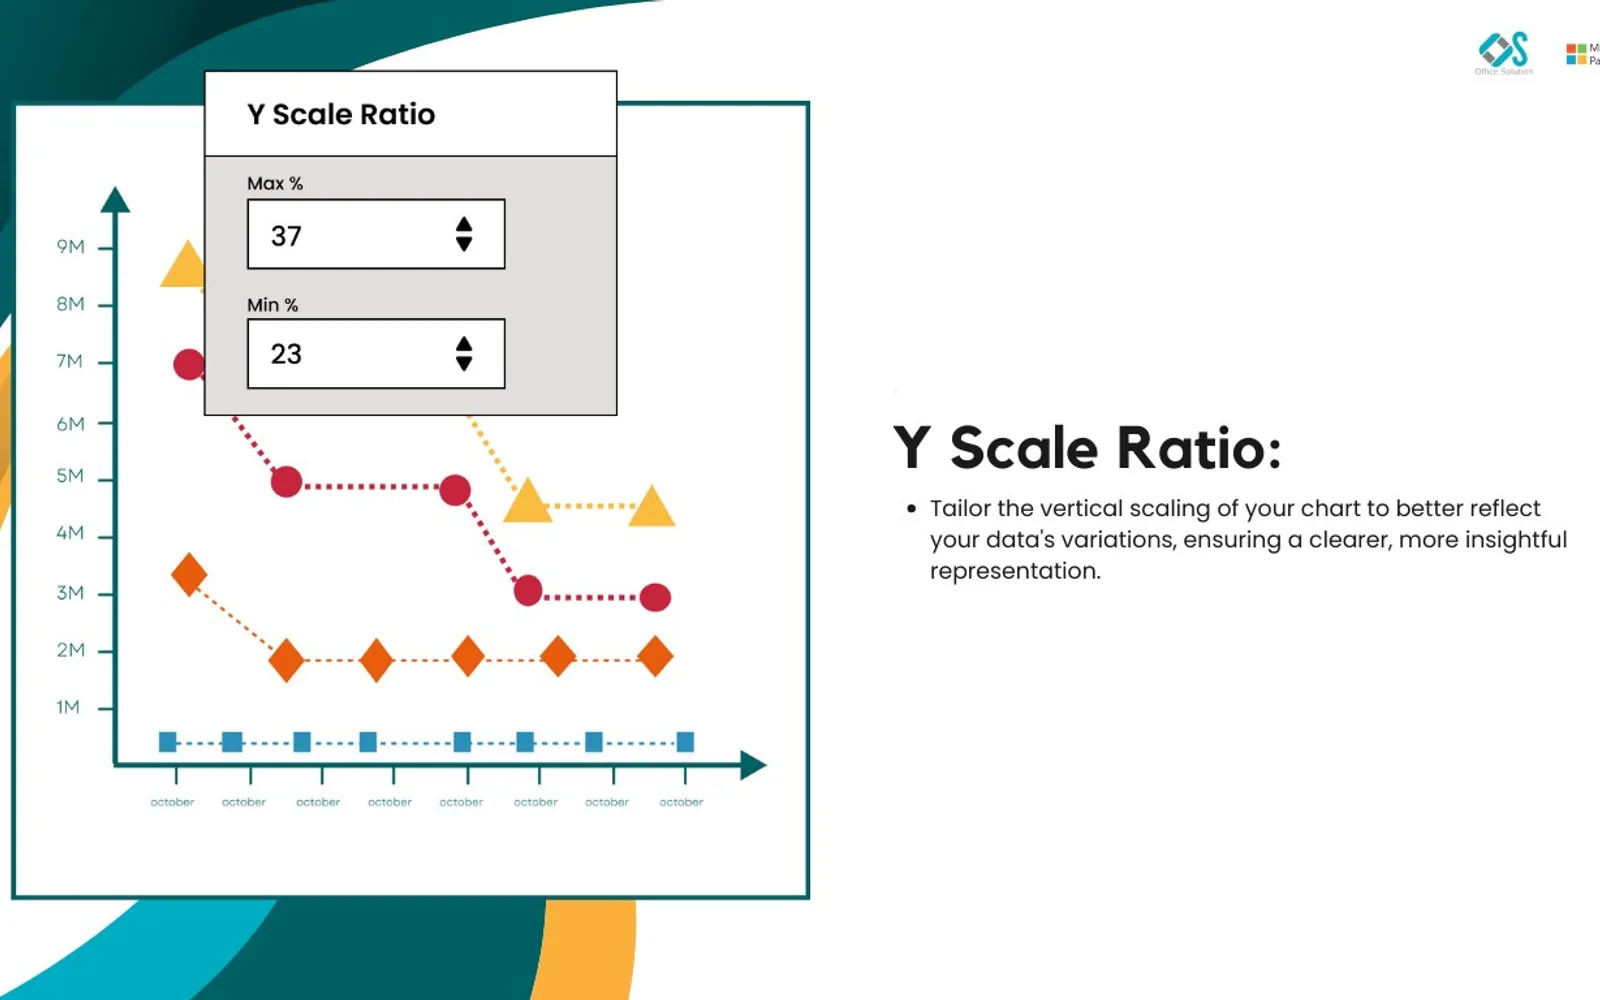
Combines lines and bubbles to display trends and data points in Power BI. Lines connect data points, while bubble size represents a numerical value. The chart includes axis controls, zooming, reference lines, custom Y-axis ranges, and configurable shapes. Users can compare two selected data points by sum, average, or difference.
Combines connected lines with bubbles whose sizes represent numerical values.
Users can flip the X and Y axes and select custom ranges for the Y axis.
Users can add growth trends, connectors, and reference lines.
Users can select two data points to view their sum, average, or difference.
Users can customize the shapes representing data points for each category.
The premium version includes a dropdown for selecting specific datasets.
The premium version can display the top N items based on bubble or line numerical values.
2,531 plugins in Power BI · Analytics
Price distribution: 125 free, 147 freemium, 1,350 paid, 909 price not published
Gantt Chart is a project management visual for Microsoft Power BI that tracks schedules, milestones, and resource workloads.
ChartPad
Creates visualizations from diverse chart types, combines multiple charts on one canvas, and adds custom annotations and tooltips.
Akvelon
Creates financial and business reports in Power BI with automatic variance calculations, P&L logic, and drill-down (s5, s6).
Zebra BI
AI analysis app for Dynamics 365 Business Central that provides customer KPIs, churn probability, and customer grouping.
Data Courage«Combination of Line and Bubble Chart for Data Analysis by Office Solution A Line and Bubble chart is a graphical representation that combines line and bubble elements to represent data points and trends in a visually distinct format. The line connects data points to display trends over time or categories, while …»