
Gantt Chart
Gantt Chart is a project management visual for Microsoft Power BI that tracks schedules, milestones, and resource workloads.
ChartPadFree
Builds Power BI bar charts with custom numeric groups, changeable axes and legends, average lines, and KPI indicators.
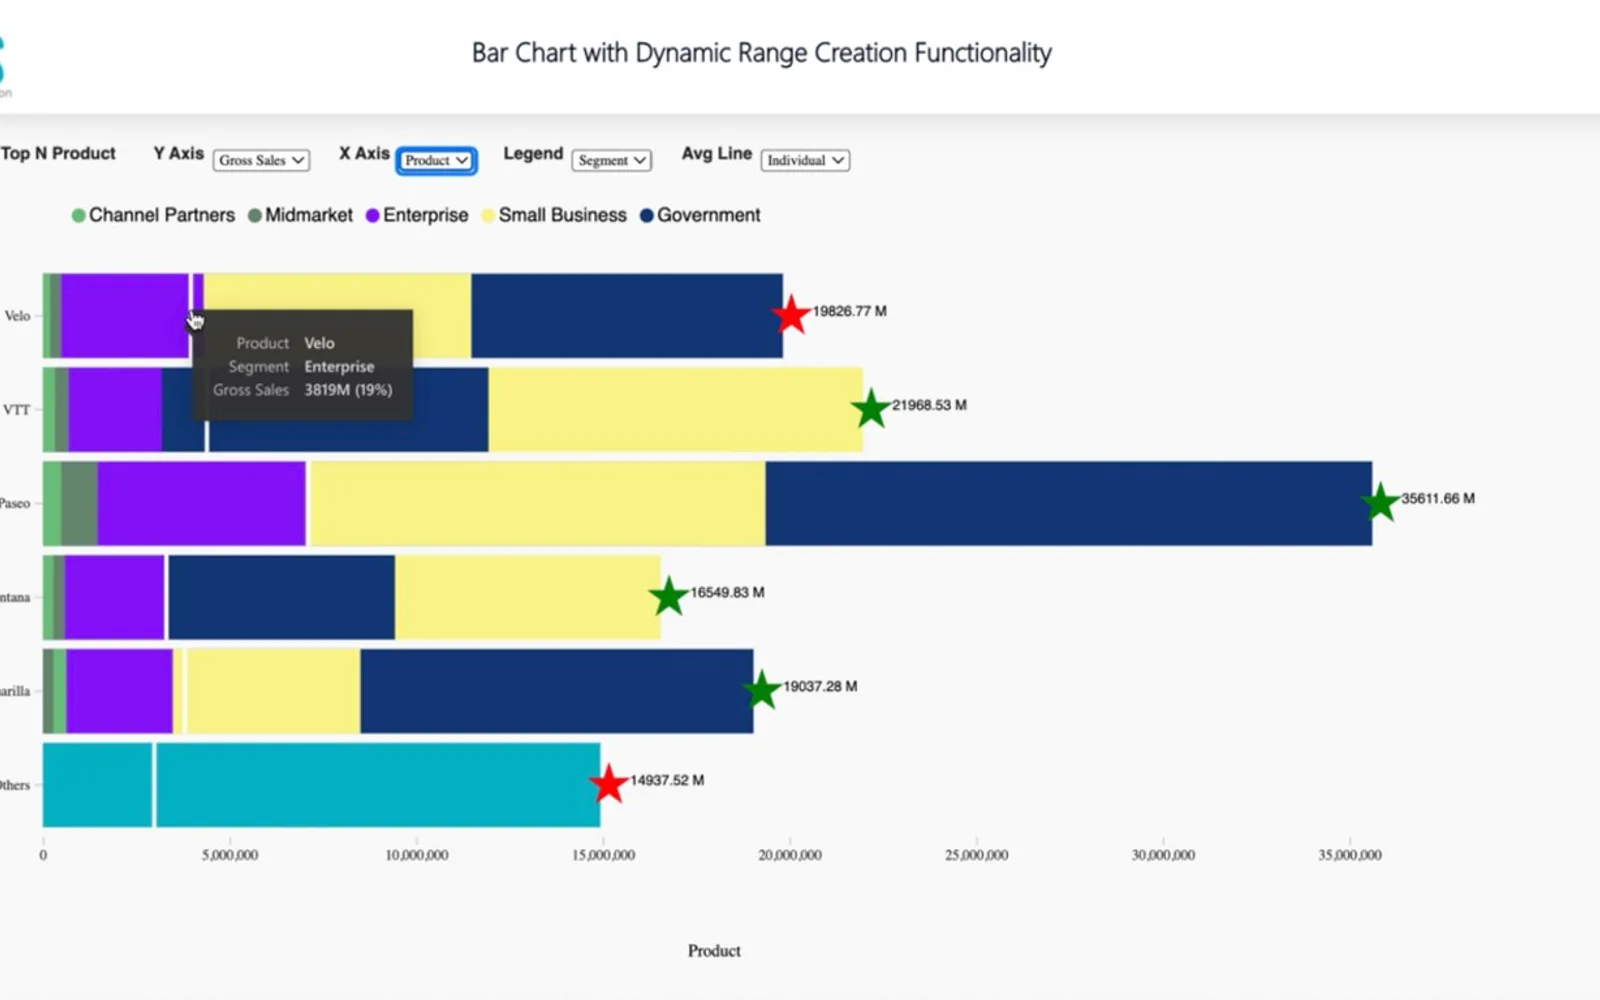
Builds bar charts whose numeric groups can be defined during use. Adds average lines for individual bars or the full chart, and compares the direction of one KPI with another. Chart dimensions, measures, and the X-axis legend can be changed during use. The visual can limit the display to five or ten areas and place a conditionally formatted KPI icon beside each bar.
Defines numeric aggregation groups during chart use.
Adds an average reference line for each bar or for the complete chart.
Compares whether one KPI is increasing or decreasing relative to another KPI.
Allows X-axis and Y-axis dimensions or measures to be changed during use.
Allows the X-axis legend to be changed during use.
Limits the displayed areas to the top five or top ten.
Places an additional KPI icon at the end of bars with conditional formatting.
Business users can change chart dimensions, measures, and legends during use.
2,531 plugins in Power BI · Analytics
Price distribution: 125 free, 147 freemium, 1,350 paid, 909 price not published
Gantt Chart is a project management visual for Microsoft Power BI that tracks schedules, milestones, and resource workloads.
ChartPad
Creates visualizations from diverse chart types, combines multiple charts on one canvas, and adds custom annotations and tooltips.
Akvelon
Creates financial and business reports in Power BI with automatic variance calculations, P&L logic, and drill-down (s5, s6).
Zebra BI
AI analysis app for Dynamics 365 Business Central that provides customer KPIs, churn probability, and customer grouping.
Data Courage«Bar Chart with Dynamic Range Creation by Office Solution This tool helps users analyze data by creating X-Axis buckets or categories themselves, allowing users to define the bucket level at which they want to aggregate numbers. Key Features: • Users can create numeric aggregation buckets as per their requirements at …»