
Gantt Chart
Gantt Chart is a project management visual for Microsoft Power BI that tracks schedules, milestones, and resource workloads.
ChartPadFree
Adds custom sorting, Top N selection, fixed top elements, item limits, and inactive states to Power BI slicers.
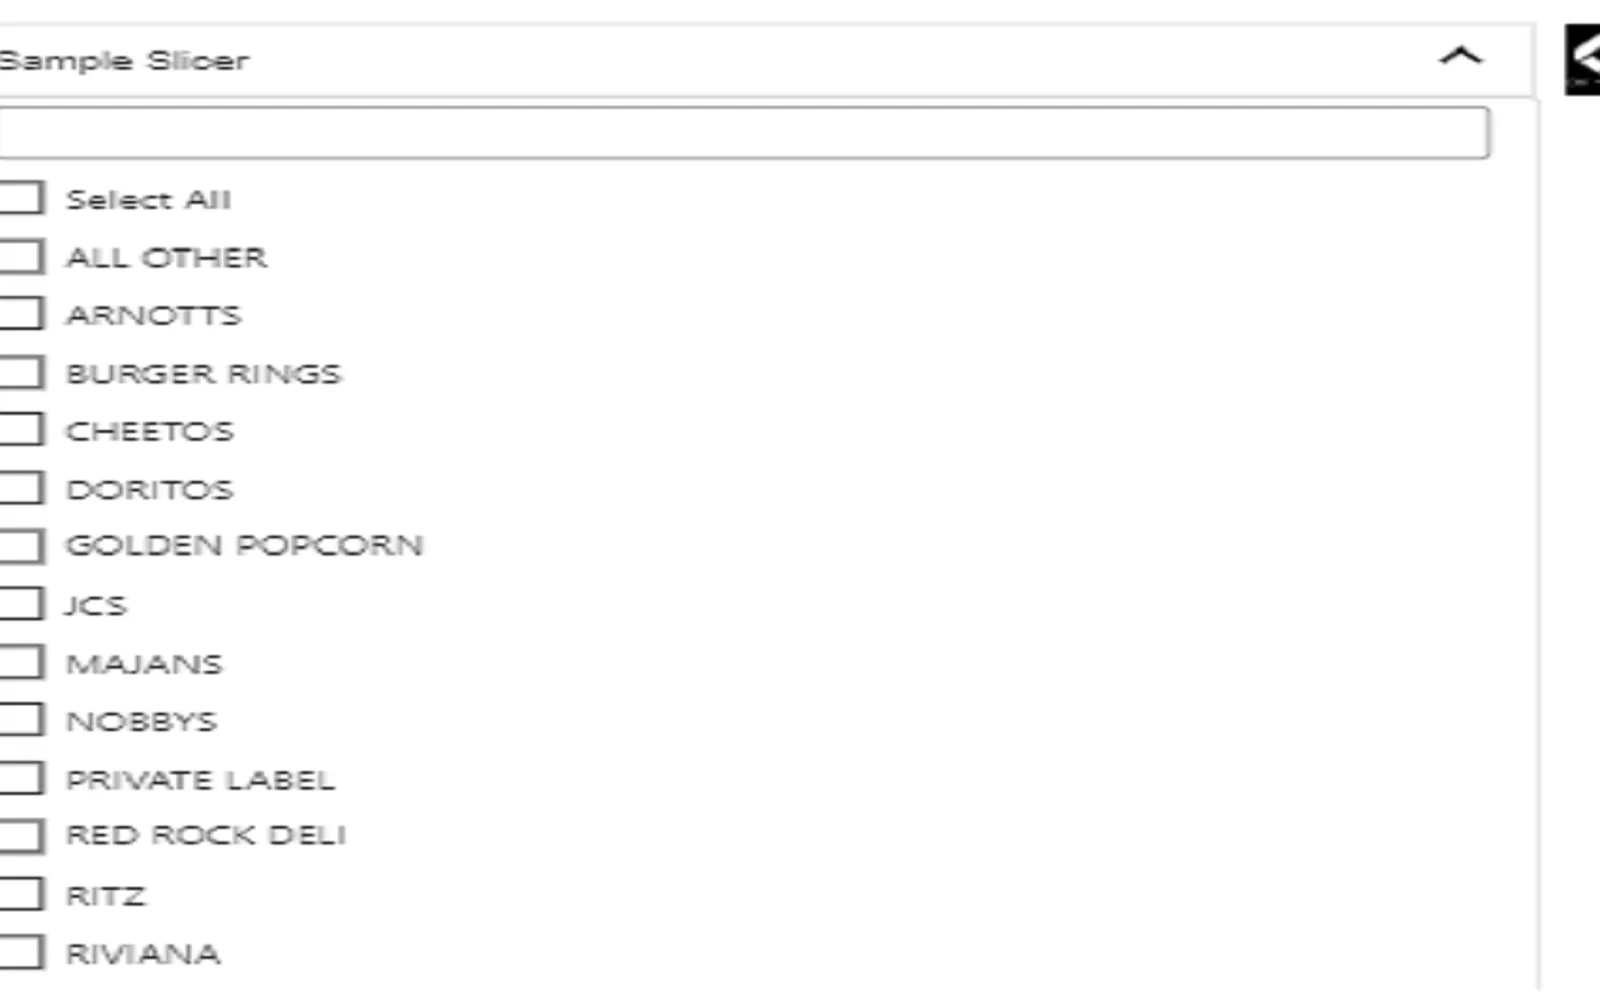
Custom Slicer sorts dropdown items by another measure and can place a predefined item first. It provides a Top N element feature without requiring a separate measure and can fix specific elements at the top. The dropdown can limit visible items based on a measure and group the remaining items under an expandable Other Category. The slicer or dropdown appears grey when no values are available.
Sorts dropdown items by another measure and can place a predefined item first.
Provides a Top N element feature without requiring a separate measure.
Fixes specific elements so they always appear at the top.
Sets the number of visible dropdown items from a measure and groups the remaining items under an expandable Other Category.
Shows the slicer or dropdown in grey when no values are available.
154 plugins in Power BI · Utilities
Price distribution: 2 free, 51 paid, 101 price not published
Gantt Chart is a project management visual for Microsoft Power BI that tracks schedules, milestones, and resource workloads.
ChartPad
Creates visualizations from diverse chart types, combines multiple charts on one canvas, and adds custom annotations and tooltips.
Akvelon
Creates financial and business reports in Power BI with automatic variance calculations, P&L logic, and drill-down (s5, s6).
Zebra BI
AI analysis app for Dynamics 365 Business Central that provides customer KPIs, churn probability, and customer grouping.
Data Courage«Sorting can be decided by another measure so that items in the dropdown appear based on the measure value, following a predefined initial item. • Top N functionality: This feature allows users to utilize the Top N element feature without needing to create a measure. • Top Fixed Element: Users can fix specific elements …»