
Gantt Chart
Gantt Chart is a project management visual for Microsoft Power BI that tracks schedules, milestones, and resource workloads.
ChartPadFree
Connects Power BI with BIM project data for clash review, issue markup, team dialogue, and reporting.
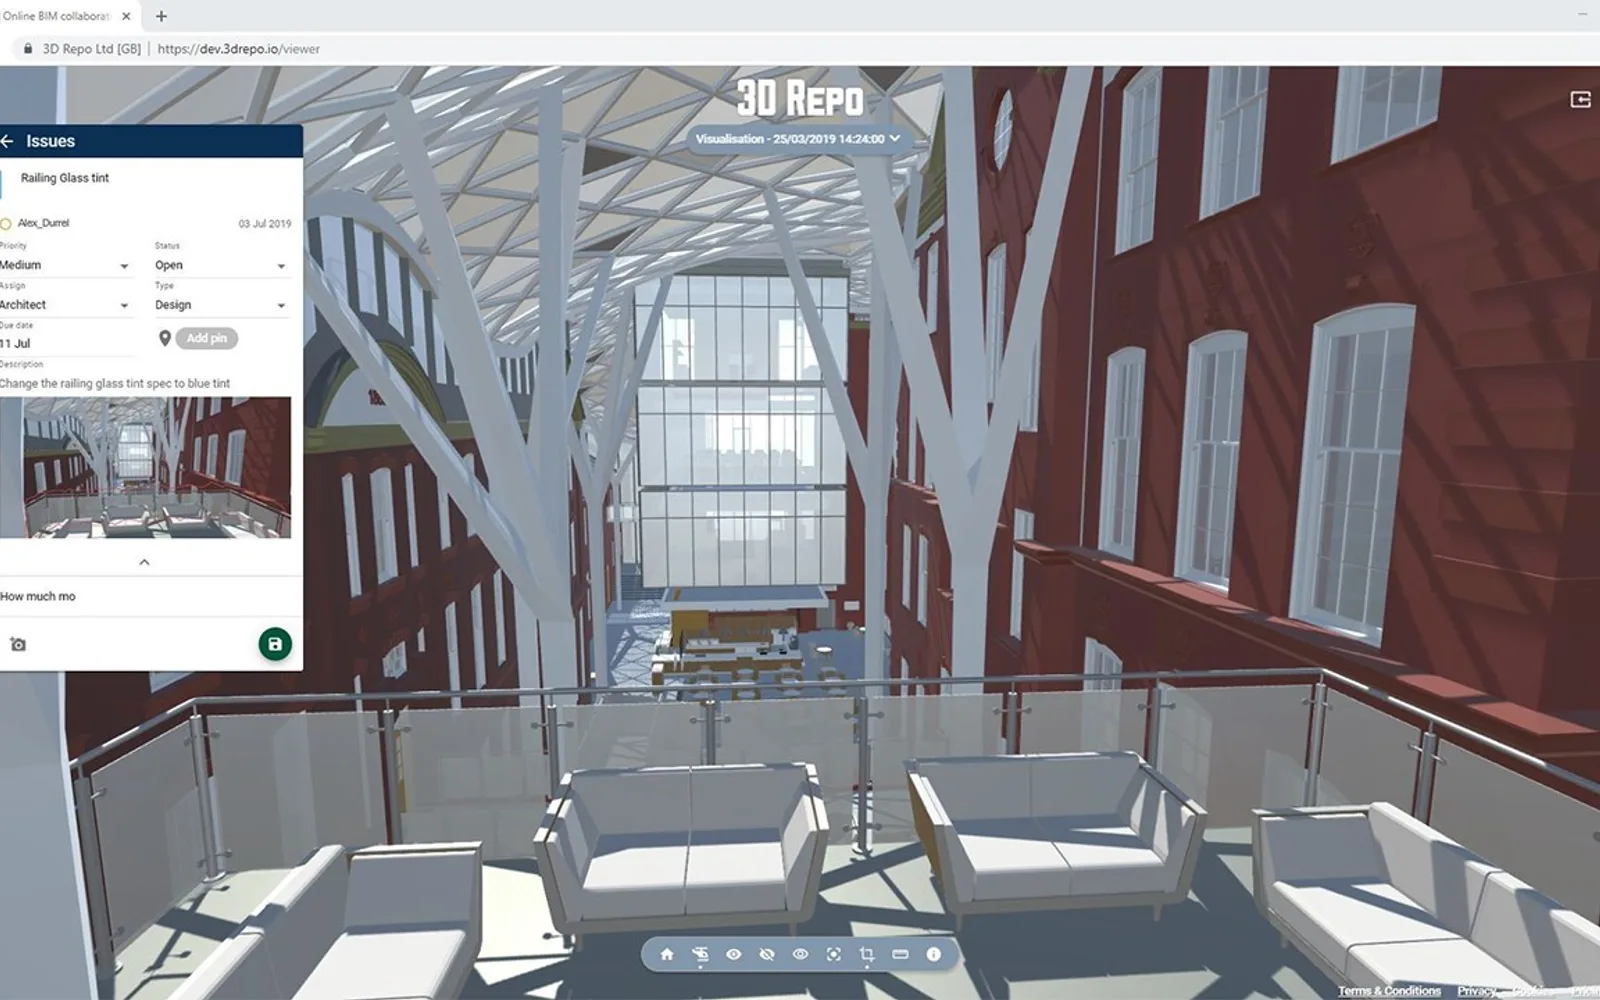
3D Repo is a platform for BIM data that lets construction teams share and communicate project information. Teams can communicate in real time while retaining a record of discussions. The platform connects with Microsoft Power BI for reports and custom dashboards using project data.
Users can mark up issues and potential safety hazards.
Teams can interact in real time while retaining a record of discussions.
The platform connects with Microsoft Power BI for reports and custom dashboards.
Architects, engineers, contractors, and other construction professionals.
1,365 plugins in Power BI · Analytics
Price distribution: 89 free, 137 freemium, 651 paid, 488 price not published
Gantt Chart is a project management visual for Microsoft Power BI that tracks schedules, milestones, and resource workloads.
ChartPad
Creates visualizations from diverse chart types, combines multiple charts on one canvas, and adds custom annotations and tooltips.
Akvelon
Creates financial and business reports in Power BI with automatic variance calculations, P&L logic, and drill-down (s5, s6).
Zebra BI
AI analysis app for Dynamics 365 Business Central that provides customer KPIs, churn probability, and customer grouping.
Data Courage«3D Repo is the multi-award-winning digital platform for BIM data. 3D Repo is transforming how construction projects are designed and delivered by democratising data, mitigating risk, and reducing complexity for everyone involved including architects, engineers, and contractors. Here to bring down the barriers to …»