
Power Plot Visual by Akvelon
Creates visualizations from diverse chart types, combines multiple charts on one canvas, and adds custom annotations and tooltips.
AkvelonFreemium
Compares two scenarios with overlaid columns across departments, regions, products, and other categories.
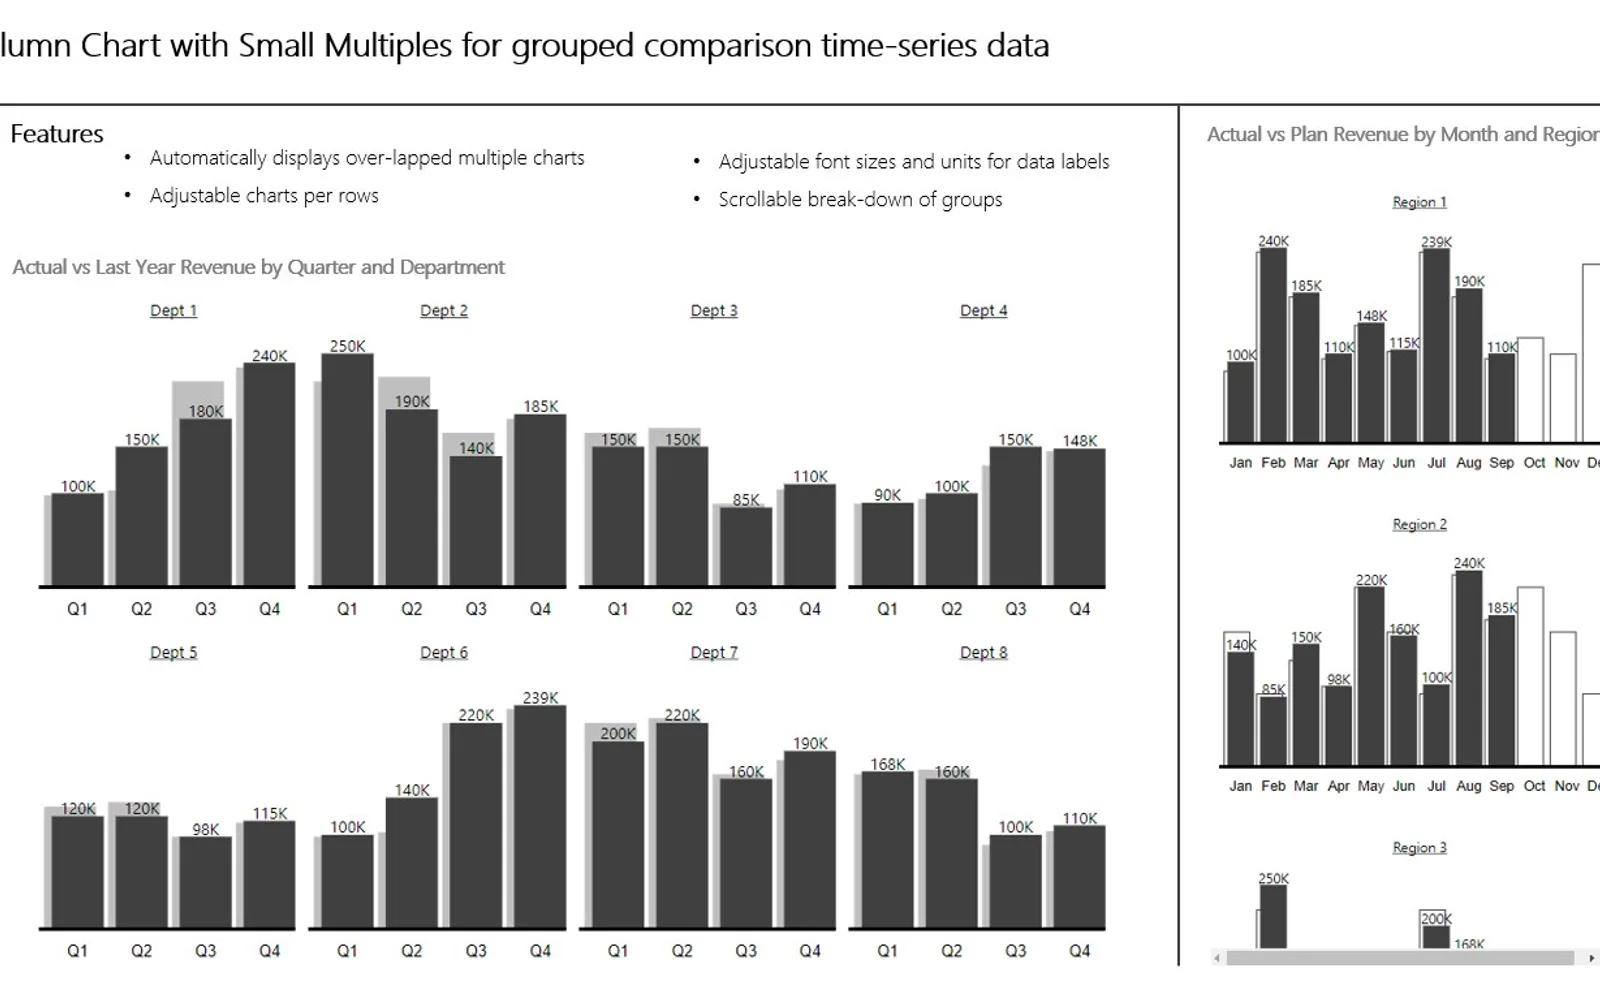
This visualization compares Actual, Forecast, Planned, and Previous Year values across categories. It breaks down items within a group and presents the results as multiple column charts. Settings include label sizing, label visibility, charts per row, and units for thousands, millions, or billions. Chart formatting follows IBCS-influenced conventions.
Supports comparisons involving Actual, Forecast, Planned, and Previous Year values.
Presents scenario data in overlaid column charts arranged in rows.
Breaks down each item included in a group section.
Provides controls for label font size, label visibility, chart count per row, and numeric units.
2,531 plugins in Analytics
Price distribution: 125 free, 147 freemium, 1,350 paid, 909 price not published
Creates visualizations from diverse chart types, combines multiple charts on one canvas, and adds custom annotations and tooltips.
Akvelon
Creates financial and business reports in Power BI with automatic variance calculations, P&L logic, and drill-down (s5, s6).
Zebra BI
COSMO Text Module provides extended text management with a WYSIWYG editor for Microsoft Dynamics 365 Business Central.
COSMO CONSULT
Discover the why behind your data.
Data Courage«Column Chart with Small Multiples compares two scenarios and displays overlapped column charts. The chart produces decomposition of each element in the group section. The visualization is meant for showing Actual, Forecast, Planned, and Previous Year data across different categories (for example departments, regions …»