
Power Plot Visual by Akvelon
Creates visualizations from diverse chart types, combines multiple charts on one canvas, and adds custom annotations and tooltips.
AkvelonFreemium
Creates bar charts that compare scenarios and show their absolute variance.
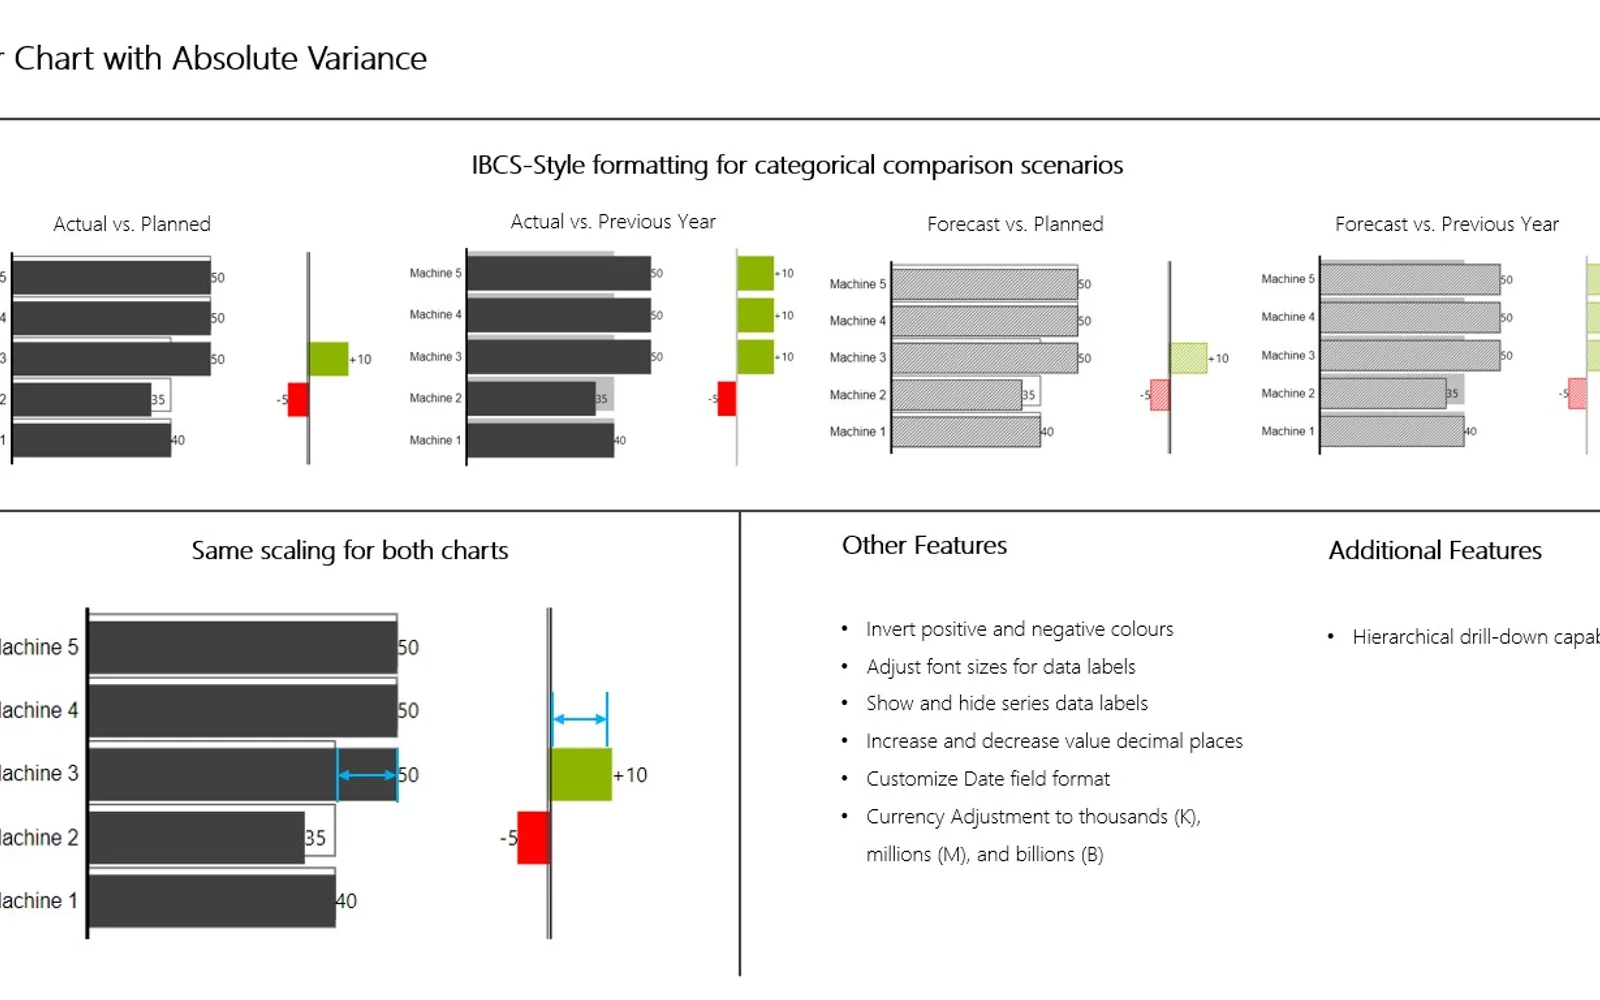
Calculates absolute variance between two scenarios and displays the comparison with overlapping bars and a separate variance chart. It supports comparisons involving Actual, Forecast, Planned, and Previous Year data. Options include color inversion, data-label sizing or hiding, category drill-down, and display units for thousands, millions, or billions.
Calculates the absolute variance between two scenarios.
Displays two scenarios with overlapping bars and a separate variance chart.
Allows data labels to be resized or hidden.
Allows the red and green chart colors to be reversed.
Supports drill-down by category.
Provides display options for thousands, millions, and billions.
2,531 plugins in Analytics
Price distribution: 125 free, 147 freemium, 1,350 paid, 909 price not published
Creates visualizations from diverse chart types, combines multiple charts on one canvas, and adds custom annotations and tooltips.
Akvelon
Creates financial and business reports in Power BI with automatic variance calculations, P&L logic, and drill-down (s5, s6).
Zebra BI
COSMO Text Module provides extended text management with a WYSIWYG editor for Microsoft Dynamics 365 Business Central.
COSMO CONSULT
Discover the why behind your data.
Data Courage«Bar Chart with Absolute Variance automatically calculates absolute variance between two scenarios and generates an overlapping bar chart that displays two scenarios with a variance chart situated parallel to the chart. The visualization is meant for comparing Actual, Forecast, Planned, and Previous Year data.»