Advanced Line Chart (Pro)
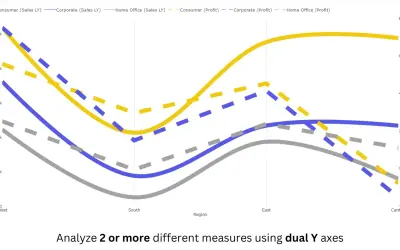
Power BI line chart visual with small multiples, reference and error bands, and categorical data on both X and Y axes.
PBIVizEdit.comFreemiumCompare
2531 analytics apps for Microsoft 365
Power BI line chart visual with small multiples, reference and error bands, and categorical data on both X and Y axes.
PBIVizEdit.com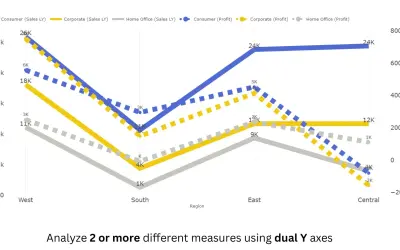
PBIVizEdit's Advanced Line Chart (Standard) creates smooth, stepped, and non-continuous line chart variations in Power BI.
PBIVizEdit.com
Linear gauge visual for Power BI that plots KPI values against a set target, with color-coded bars and tooltips.
MAQ LLC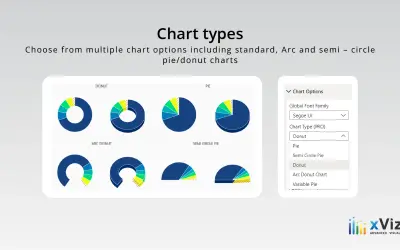
An xViz pie and donut chart for Power BI that compares parameters and displays each part's proportion of the whole.
xViz LLC dba Lumel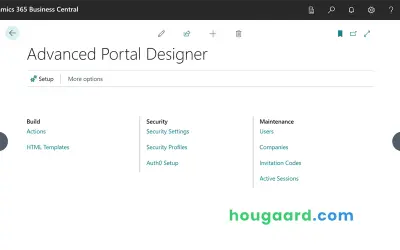
Build and customize public portals for Microsoft Dynamics 365 Business Central with controlled data access for external users.
Hougaard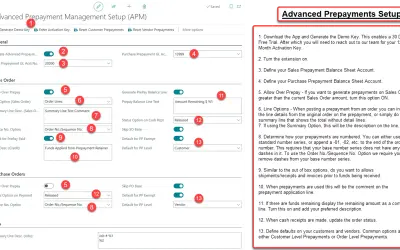
Advanced Prepayments manages customer, vendor, and job prepayments as pooled funds inside Business Central for NA localizations.
RUX Software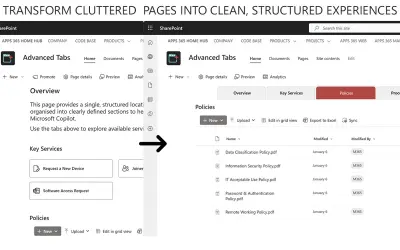
Groups related content into labelled tabs in SharePoint Online to reduce scrolling and support efficient page navigation.
APPS 365 LTD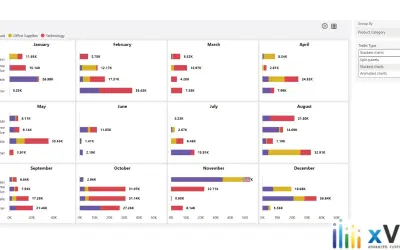
Advanced Trellis splits charts with common axes across categories for trend analysis as a custom visual for Microsoft Power BI.
xViz LLC dba Lumel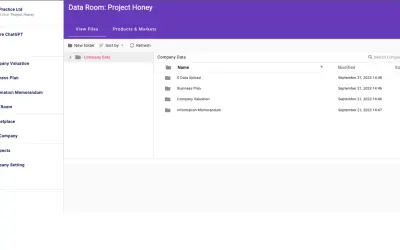
Create Business Plans & Company Valuation Reports for you and your clients.
M&A Deal Platform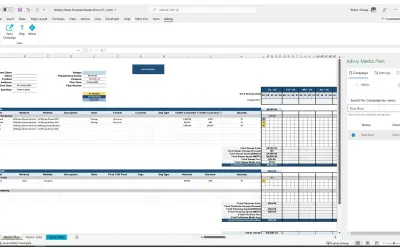
Advvy Media Plan Sync syncs Excel media plan data to campaign records in the Advvy Agency Workflow application.
Advvy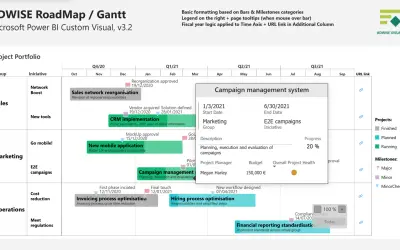
Visual that presents project, portfolio, product, or campaign plans with phases and milestones in a one-page or scrollable view.
Adwise s.r.o.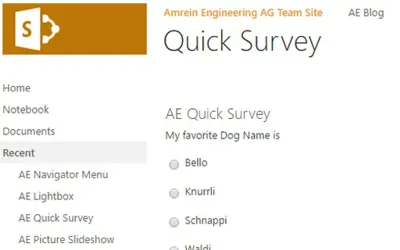
AE Quick Survey is a SharePoint Add-in that publishes single-question polls with pie chart results stored in a SharePoint List.
Amrein Engineering AG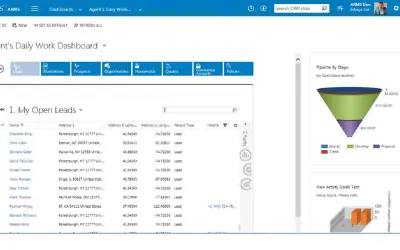
Infosys ARMS manages agency relationships, lead pipelines, and broker collaboration for Microsoft Dynamics 365 in insurance.
Infosys Limited
Enables organizations to create and deploy sovereign, agentic AI systems tailored to specific business needs with control.
rambim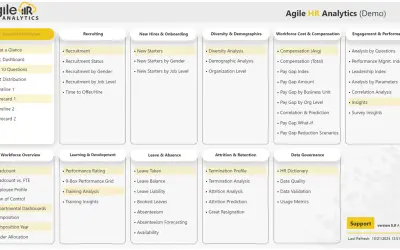
Self-hosted HR analytics solution for Microsoft Power BI that helps HR professionals make data-driven workforce decisions.
Agile Analytics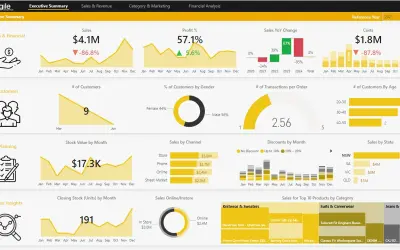
Retail analytics dashboards for Microsoft Power BI providing oversight of product performance, sales, and inventory.
Agile Analytics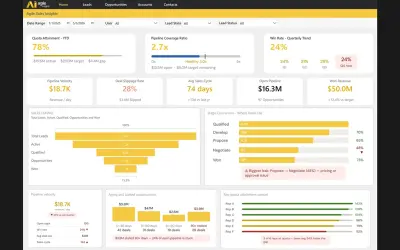
Power BI app for Dynamics 365 Sales with 16 dashboard pages and 80+ pre-mapped KPIs across pipeline and rep performance.
Agile Analytics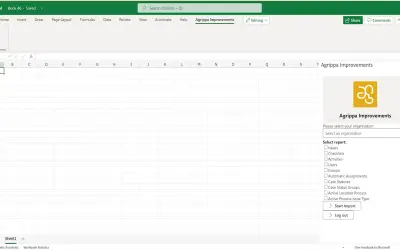
Excel add-in that exports Agrippa Improvements data to Excel for custom reports, charts, and data visualization.
Agrippa Solutions Sp. z.o.o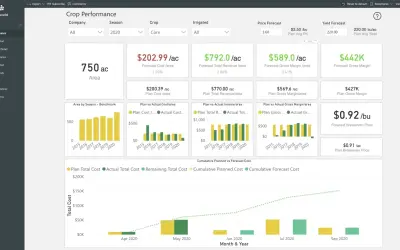
Agworld for Growers lets Agworld subscribers visualize on-farm costs, break down cost of production, and forecast seasonal costs.
Agworld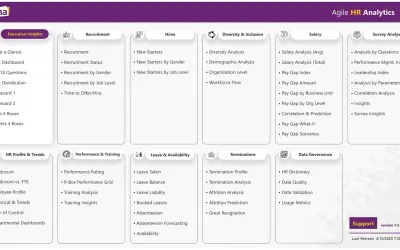
Pre-built Power BI packages deliver structured workforce reporting for HR and business leaders in Microsoft environments.
Agile Analytics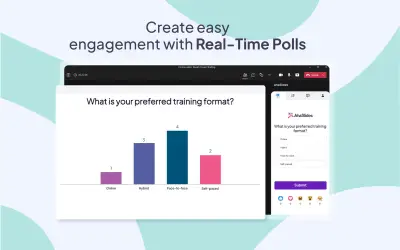
AhaSlides adds polls, quizzes, word clouds, and Q&A activities to presentations delivered inside Microsoft Teams.
AhaSlides
Add live polls, quizzes, word clouds, and feedback tools to PowerPoint presentations using the AhaSlides add-in.
AhaSlides