Innofalls Charts
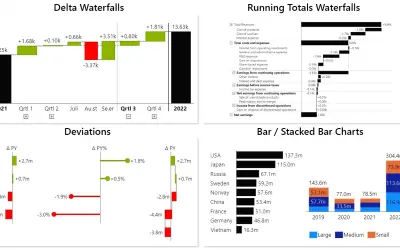
Power BI visual for building waterfall and bar charts through interactive navigation, drill downs, and dynamic comparisons.
Innofalls GmbHFreemiumCompare
147 analytics apps for Microsoft 365
Power BI visual for building waterfall and bar charts through interactive navigation, drill downs, and dynamic comparisons.
Innofalls GmbH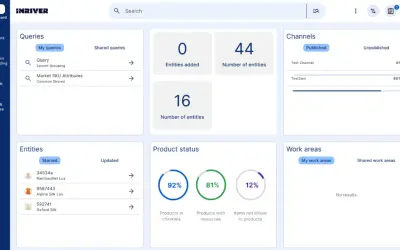
Inriver PIM is a scalable SaaS platform that manages product data with built-in AI, syndication, and digital shelf analytics.
inRiver AB
iPlanner Pro centralizes task management across Microsoft Teams, Outlook, and Planner within the Microsoft 365 ecosystem.
iGlobe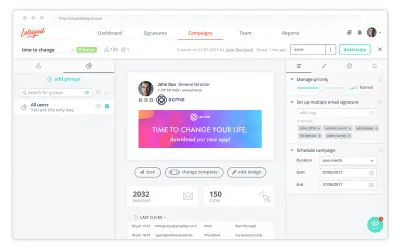
Letsignit is a cloud-based email signature management tool that distributes standardized signatures on Office 365 and G Suite.
Letsignit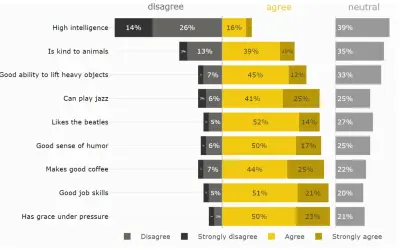
Power BI custom visual offering bar customization, advanced sorting, custom labels, and small multiple/Trellis layouts.
PBIVizEdit.com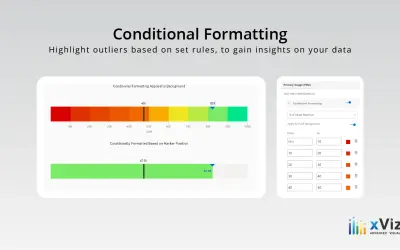
Power BI custom visual that shows progress toward a goal as a linear gauge or progress bar with configurable targets and labels.
xViz LLC dba Lumel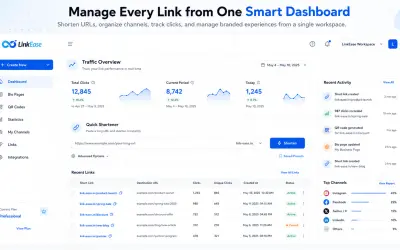
LinkEase provides short links, QR codes, bio pages, and click analytics for businesses, creators, and teams from one workspace.
SouqProcare LTD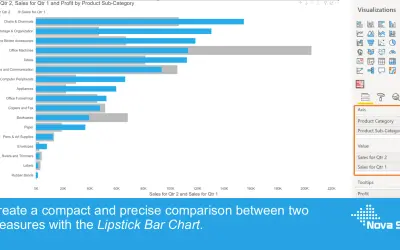
Lipstick Bar Chart overlays a primary and secondary measure per category as a Power BI visual for precise value comparison.
Nova Silva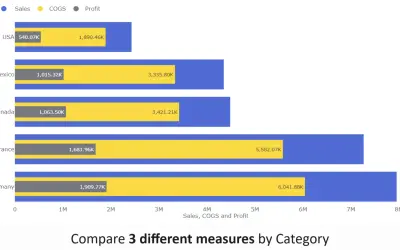
Lipstick Bar Chart (Pro) provides conditional formatting, trellis layouts, and analytics panels for Power BI visualizations.
PBIVizEdit.com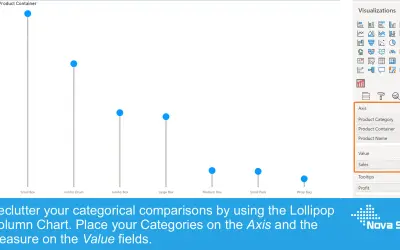
Lollipop Column Chart displays a marker and line per category as an alternative to standard column charts in Power BI.
Nova Silva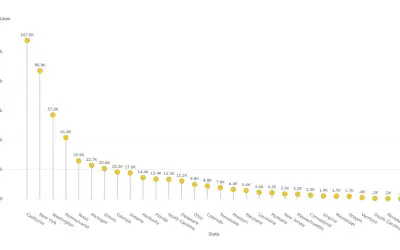
Lollipop Column Chart (Pro) adds small multiples, analytics panels, and marker formatting to Power BI reports.
PBIVizEdit.com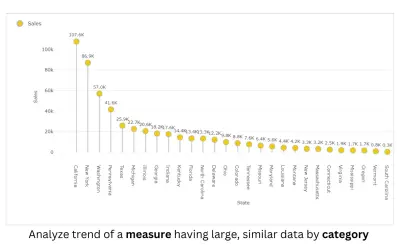
Lollipop Column Chart (Standard) renders lollipop column visuals with analytics and formatting options for Microsoft Power BI.
PBIVizEdit.com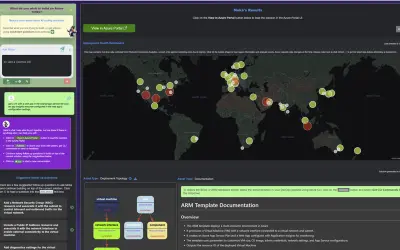
Generates deployable ARM and Bicep templates from natural language and monitors Azure deployment health across regions.
StratusOn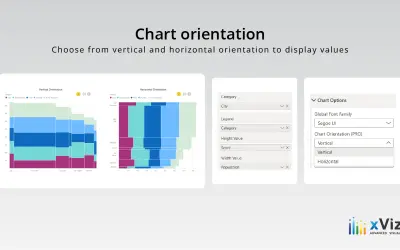
Marimekko Chart - xViz renders 2D stacked charts for Power BI to segment data by category, region, or product dimensions.
xViz LLC dba Lumel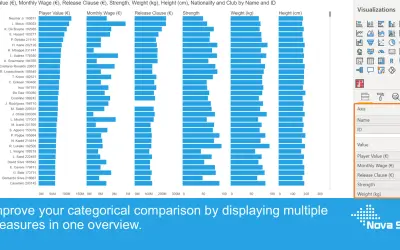
Merged Bar Chart displays up to 12 independent measures per category in a single visual for Power BI Desktop and Service.
Nova Silva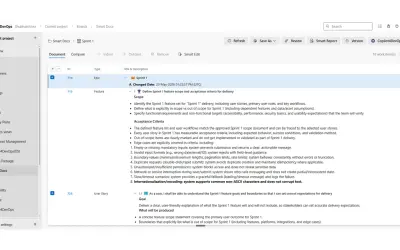
A browser-based extension for Azure DevOps to author, trace, and manage requirements across Agile and hybrid process templates.
Modern Requirements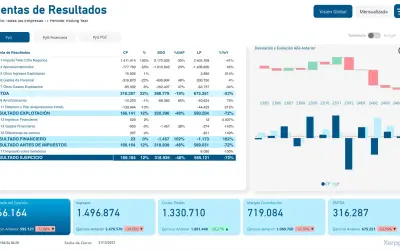
Multilevel Matrix Xerppa is an advanced visual for Power BI that organizes and displays complex hierarchical data structures.
Gestión y Finanzas 365 SL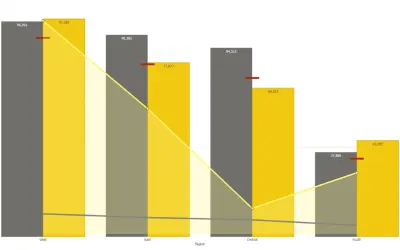
PBIVizEdit's Multiple Axes Chart (Standard) displays mixed data types on separate axes within one Power BI visual.
PBIVizEdit.com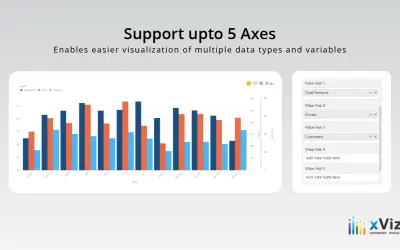
Power BI visual for plotting multiple data series on up to five axes, with 20+ chart configurations and annotations.
xViz LLC dba Lumel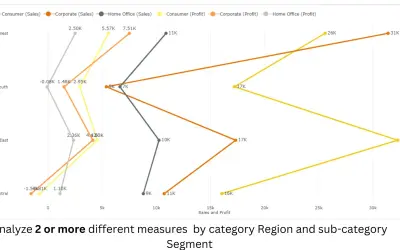
Multiple Vertical Line Chart (Pro) for Power BI creates smooth, non-continuous, and stepped vertical line chart variations.
PBIVizEdit.com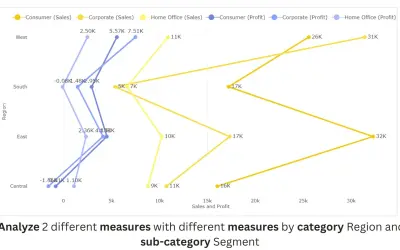
PBIVizEdit's Multiple Vertical Line Chart (Standard) creates smooth, non-continuous, and stepped vertical line charts in Power BI.
PBIVizEdit.com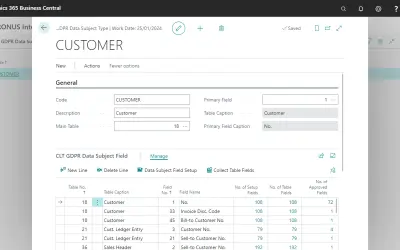
OIXIO GDPR provides data subject inquiry management, depersonalization, and reporting tools for Dynamics 365 Business Central.
UAB OIXIO