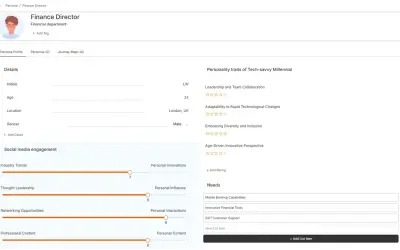
Cemantica Customer Journey Management platform
Cemantica provides end-to-end journey management and VoC data integration for Microsoft Dynamics 365 environments.
CemanticaPaidCompare
1350 analytics apps for Microsoft 365
Cemantica provides end-to-end journey management and VoC data integration for Microsoft Dynamics 365 environments.
Cemantica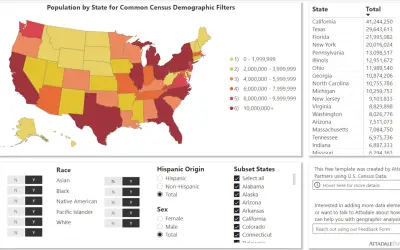
Power BI app template for setting up maps of U.S. Census demographics for marketing, strategy, and facilities planning.
Attadale Partners, LLCCentilytics manages, secures, and optimizes public cloud infrastructure for Microsoft Azure and Amazon Web Services environments.
Progressive Infotech Pvt. Ltd.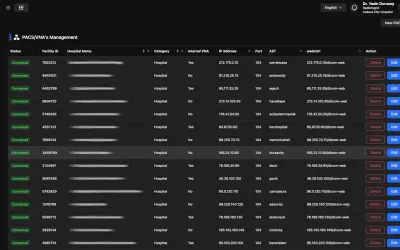
CMIP integrates with PACS, VNA, EMR, HIE, and HIS systems to centralize medical imaging management for healthcare facilities.
Oteo Health
Channels by Telelogos delivers targeted messages, urgent alerts, and surveys directly to employee desktops and mobile devices.
TELELOGOS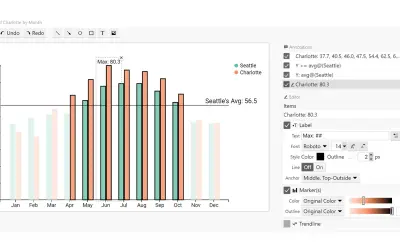
A ChartAccent visual that creates annotated bar charts and highlights individual bars, data series, or above-average bars.
Donghao Ren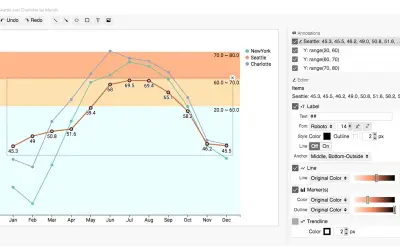
ChartAccent - LineChart is an open source tool for creating annotated line charts by highlighting data points and series.
Donghao Ren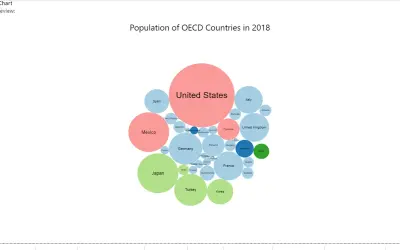
Displays ready chart templates built with the original Charticulator or Editor visual inside Microsoft Power BI reports.
Ilfat Galiev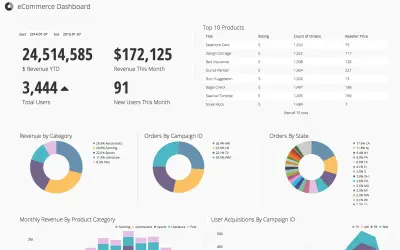
Chartio is a cloud-based analytics tool that lets teams access, explore, transform, and visualize data from SQL databases.
Chartio
A Power BI plugin that lets developers embed AI agents so report users can query their data in natural language.
Chartenza
CheckVentory Auditor reconciles 100% of assets across multiple locations for the funded vehicle inventory sector.
CheckVentory Innovation
Button-based slicer for Power BI that can be arranged horizontally or as a matrix, with cross highlighting and image support.
Microsoft Corporation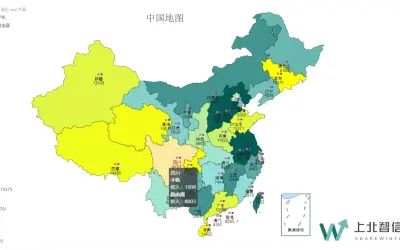
China Color Map provides offline China and provincial maps with one-click switching, drill-down, and color-shaded value display.
北京上北智信科技有限公司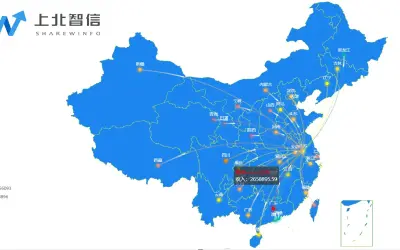
China Flow Map provides offline map rendering, one-click national or provincial switching, and visual configuration for reports.
北京上北智信科技有限公司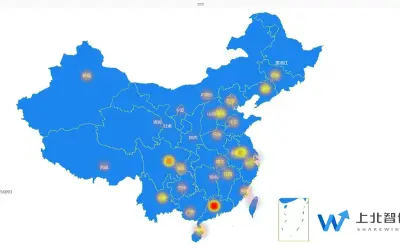
China Heat Map visualizes the regional distribution of data across China, with darker colors indicating larger data volumes.
北京上北智信科技有限公司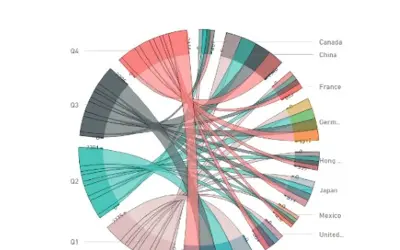
An open source Power BI visual that displays inter-relationships between entities using arcs or Bézier curves.
Microsoft Corporation
Ciao provides voice and video calls, screen sharing, group chat, and PSTN outbound calling for team collaboration across devices.
DotConnect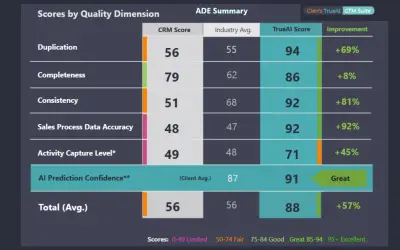
TrueAI GTM Suite MM Annual Subscription delivers CRM data augmentation and operational analysis for mid-market go-to-market teams.
Cien Global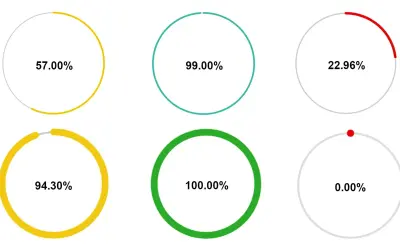
Circle KPI Gauge represents the percentage of data for each KPI as a donut chart consisting of an outer and an inner ring.
Paypal_ITA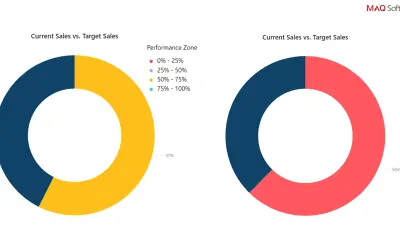
Circular Gauge by MAQ Software displays actual values or percentages against targets in pie or donut chart formats for Power BI.
MAQ LLC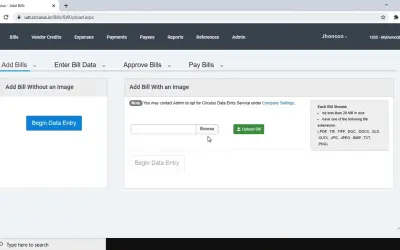
Circulus consolidates bill management, expense reports, and invoices into a single interface for accounts payable automation.
XTGlobal Inc.
Inserts properly formatted citations and bibliographies into Word documents from a central library of PDFs and sources.
Swiss Academic Software GmbH