
Power Plot Visual by Akvelon
Creates visualizations from diverse chart types, combines multiple charts on one canvas, and adds custom annotations and tooltips.
AkvelonFreemium
Chinese heat maps display regional data with adjustable colors, intensity, blur, and map scope.
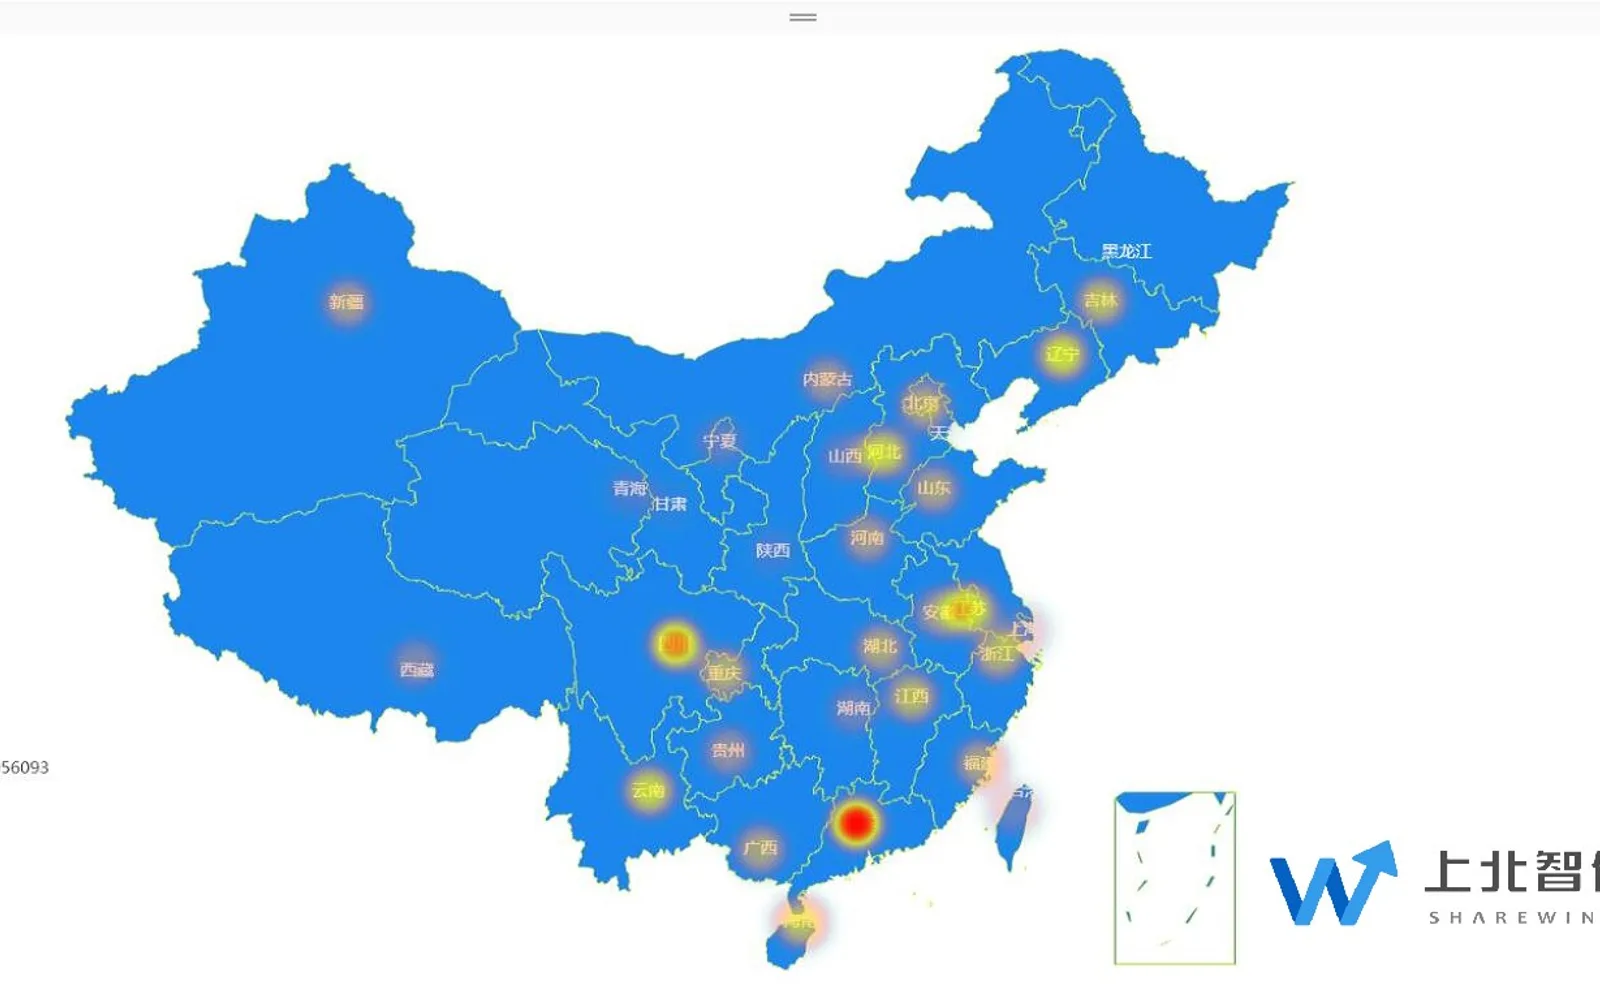
Displays Chinese geographical data as heat maps, using color differences to represent regional data distribution. Color intensity and blur can be adjusted, with larger data amounts shown in darker blocks. The add-in supports offline maps and switching between a China map and provincial maps. Configuration options include latitude and longitude markers, color gradients, titles, legends, text attributes, highlighted areas, and data-point colors.
Maps can be loaded and used without repeatedly opening an online map source.
A configuration setting switches between the national map and provincial maps.
The map classifies data by color according to the selected gradient range and data amount.
Settings include latitude and longitude markers, titles, legends, text attributes, highlighted areas, and data-point colors.
2,531 plugins in Analytics
Price distribution: 125 free, 147 freemium, 1,350 paid, 909 price not published
Creates visualizations from diverse chart types, combines multiple charts on one canvas, and adds custom annotations and tooltips.
Akvelon
Creates financial and business reports in Power BI with automatic variance calculations, P&L logic, and drill-down (s5, s6).
Zebra BI
COSMO Text Module provides extended text management with a WYSIWYG editor for Microsoft Dynamics 365 Business Central.
COSMO CONSULT
Discover the why behind your data.
Data Courage«Designed for the Chinese geographical data, thermal maps can be classified by region of the data displayed on the map, through different colors to render the analysis of the area distribution of objects, and can adjust the display of color intensity and blur degree. The larger the amount of data, the darker the color …»