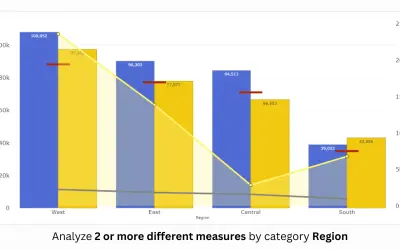
Dual Y-Axis Combo Chart (Standard)
PBIVizEdit custom visual for Power BI that builds dual y-axis charts combining line, area, scatter, and column series.
PBIVizEdit.comFreemium
Build and reuse custom chart designs inside Power BI with Charticulator templates.
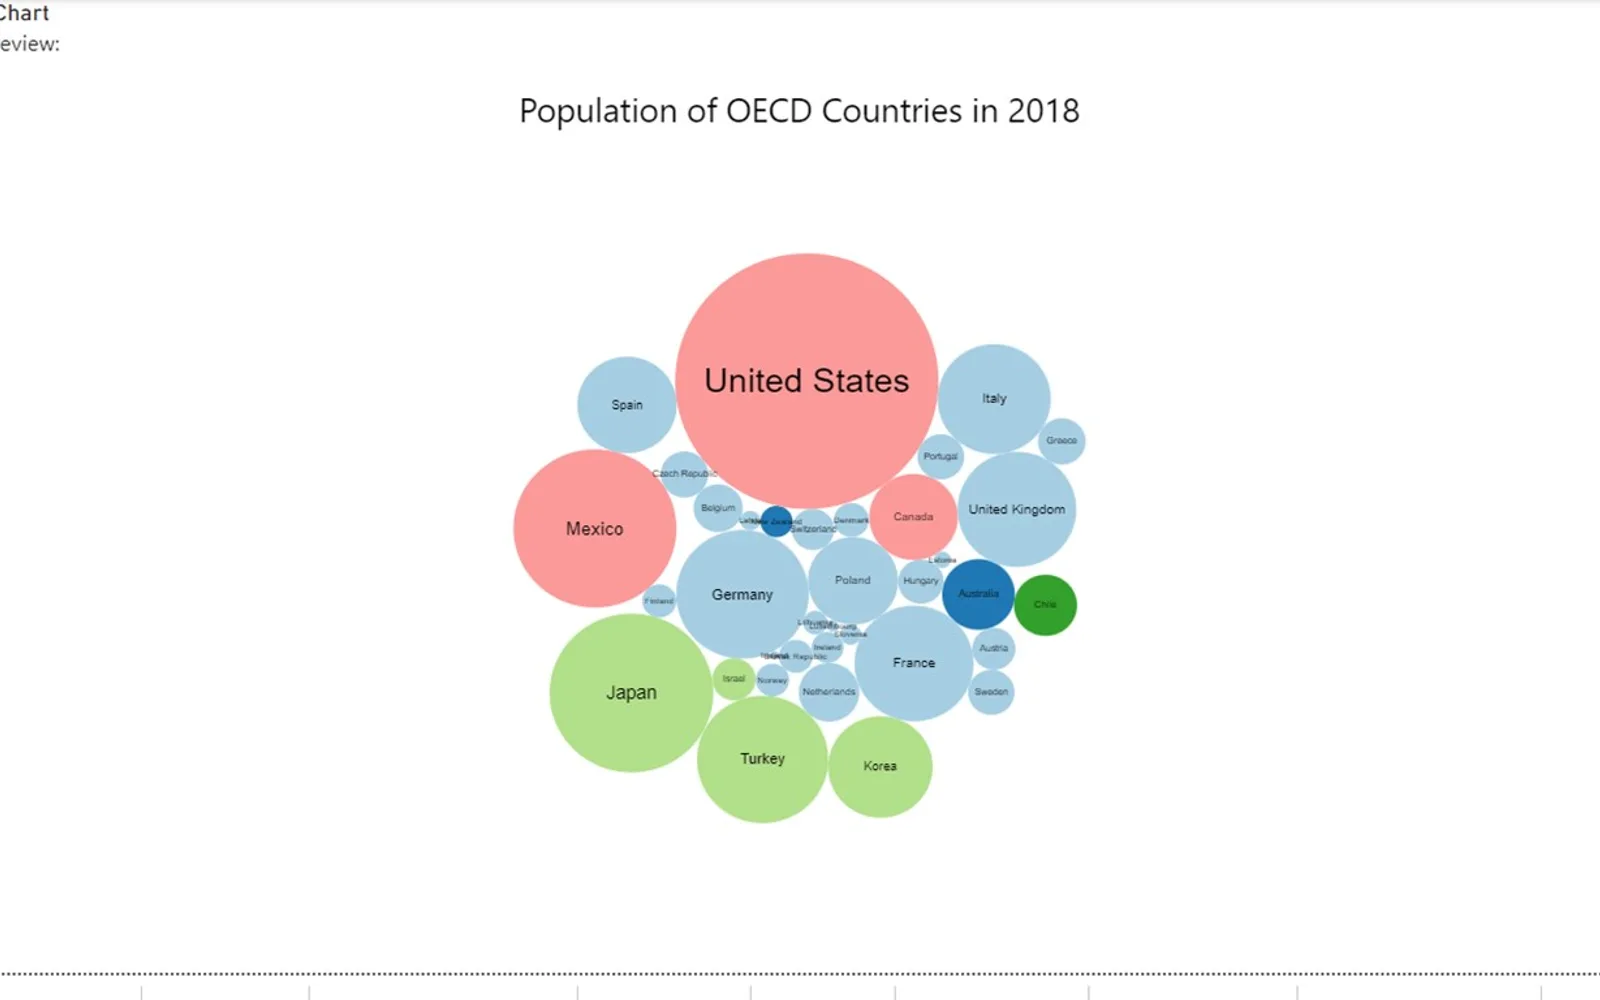
Creates custom charts in Power BI either from a blank design or an existing template. Chart designs can be saved as templates and loaded again for later use. This edition renders prepared templates made with Charticulator or its newer Editor visual and does not include the embedded editor. Supported browsers include current Microsoft Edge, Google Chrome, and Mozilla Firefox; Edge Legacy and Safari are not supported.
Creates chart designs in Power BI from a blank starting point or a template.
Saves a chart design as a Charticulator template.
Loads Charticulator templates for reuse.
Displays templates produced with the original visual or the newer Editor visual.
Charticulator Visual Community (View) uses a paid pricing model and cloud deployment. Dual Y-Axis Combo Chart (Standard) and Advanced Line Chart (Pro) use freemium pricing, while Ridgeline Plot by Powerviz is free; all three are cloud-deployed. 100% Clustered Stacked Bar Chart (Standard) and Progress Icon also use paid pricing and cloud deployment.
| Name | Pricing | Deployment | Updated |
|---|---|---|---|
| this plugin | Paid | Cloud | |
| Dual Y-Axis Combo Chart (Standard) | Freemium | Cloud | |
| Advanced Line Chart (Pro) | Freemium | Cloud | |
| Ridgeline Plot by Powerviz | Free | Cloud | |
| 100% Clustered Stacked Bar Chart (Standard) | Not in catalog | ||
| Progress Icon | Paid | Cloud | |
657 plugins in Power BI · Analytics
Price distribution: 73 free, 108 freemium, 441 paid, 35 price not published
PBIVizEdit custom visual for Power BI that builds dual y-axis charts combining line, area, scatter, and column series.
PBIVizEdit.com
Power BI custom visual that fills an SVG icon to show KPI progress toward a target instead of a plain number on a card.
NeenOpal Inc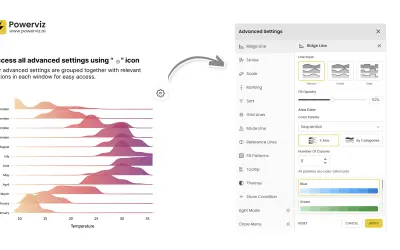
Custom Power BI visual that plots numeric distributions for multiple categories as stacked curves along a common continuous axis.
TRUVIZ INC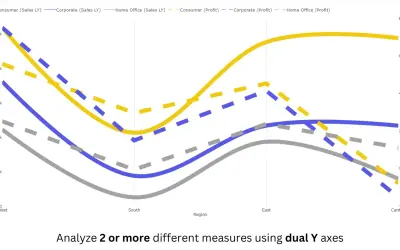
Power BI line chart visual with small multiples, reference and error bands, and categorical data on both X and Y axes.
PBIVizEdit.com«Create custom and reusable charts right within Power BI Charticulator (https://ilfat-galiev.im/charticulator/) is the no-code way to create custom and reusable chart designs. You can create a custom chart right within Power BI using the Microsoft Charticulator Visual, either from scratch or using a template. With this …»