
Gantt Chart
Gantt Chart is a project management visual for Microsoft Power BI that tracks schedules, milestones, and resource workloads.
ChartPadFree
Displays hierarchical information in Power BI with images, two measures, and percentage calculations.
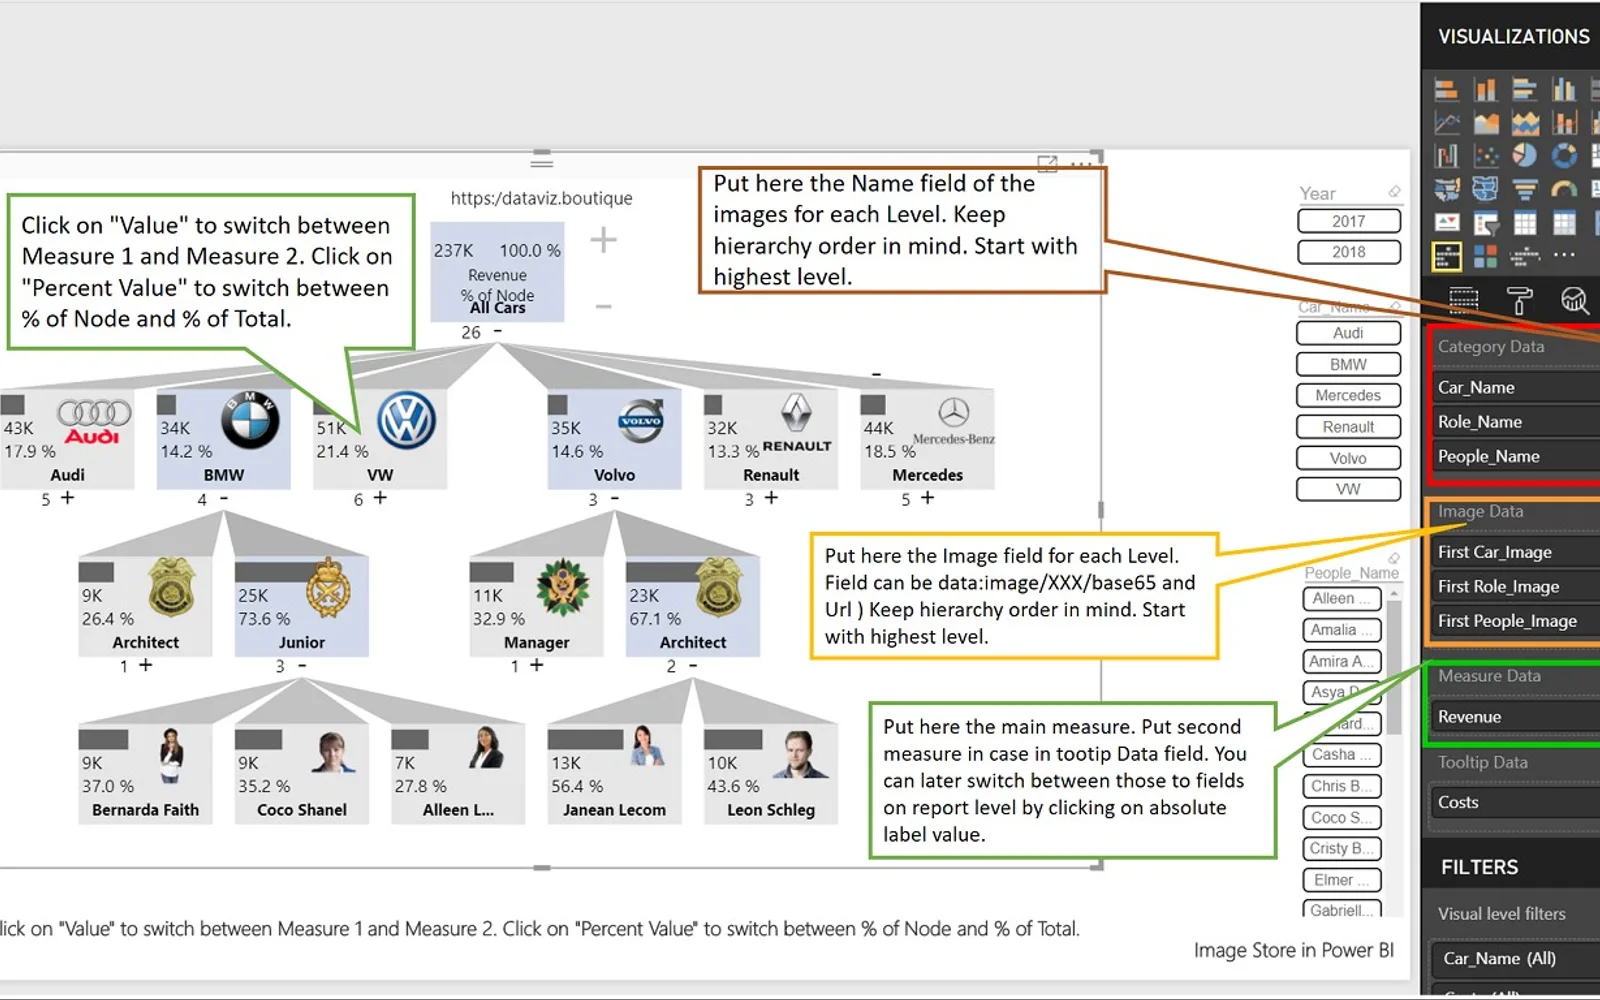
Displays hierarchical information as a decomposition tree or breakdown chart in Power BI. It combines images with two measures and supports percentage calculations by node or total. Available settings include image sources, vertical or horizontal orientation, bars for absolute values, and other chart customizations. The free version allows four elements on one level, while advanced features add a watermark.
Displays hierarchical information as a decomposition tree or breakdown chart.
Supports images from web URLs or images stored in Power BI.
Supports displaying two measures.
Provides percentage calculations for nodes or totals.
Supports vertical and horizontal orientations.
Uses bars as indicators for absolute values.
Provides multiple customization settings.
2,531 plugins in Power BI · Analytics
Price distribution: 125 free, 147 freemium, 1,350 paid, 909 price not published
Gantt Chart is a project management visual for Microsoft Power BI that tracks schedules, milestones, and resource workloads.
ChartPad
Creates visualizations from diverse chart types, combines multiple charts on one canvas, and adds custom annotations and tooltips.
Akvelon
Creates financial and business reports in Power BI with automatic variance calculations, P&L logic, and drill-down (s5, s6).
Zebra BI
AI analysis app for Dynamics 365 Business Central that provides customer KPIs, churn probability, and customer grouping.
Data Courage«Basic Features are free. Once advanced features are used, a watermark will appear. With the Setting “revert to default” the watermark will be removed again. To remove the Watermark, order your Trial License: license@dataviz.boutique or visit http://dataviz.boutique/ ; https://datadriven.pro/blog . The Ultimate …»