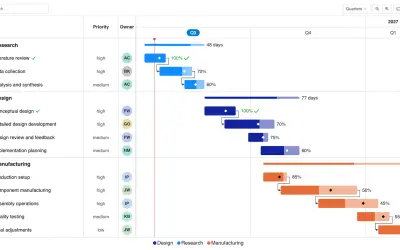
Gantt Chart
Gantt Chart is a project management visual for Microsoft Power BI that tracks schedules, milestones, and resource workloads.
ChartPadFree
Create interactive legends in Power BI with custom markers, colours, labels, layouts, and sorting.
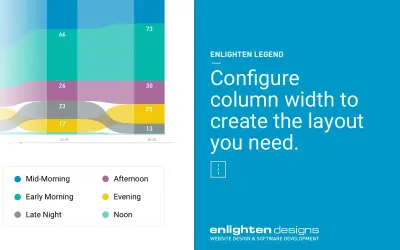
Creates independent interactive legends with configurable marker shapes, data colours, label formatting, hover colours, grid layouts, and custom sort ordering.
Creates independent legends that users can interact with.
Configures marker shapes and data colours.
Sets label formatting options, including hover colours.
Arranges legend items using a configurable grid layout.
Sorts legend items according to defined rules.
2,531 plugins in Power BI · Analytics
Price distribution: 125 free, 147 freemium, 1,350 paid, 909 price not published
Gantt Chart is a project management visual for Microsoft Power BI that tracks schedules, milestones, and resource workloads.
ChartPad
Creates visualizations from diverse chart types, combines multiple charts on one canvas, and adds custom annotations and tooltips.
Akvelon
Creates financial and business reports in Power BI with automatic variance calculations, P&L logic, and drill-down (s5, s6).
Zebra BI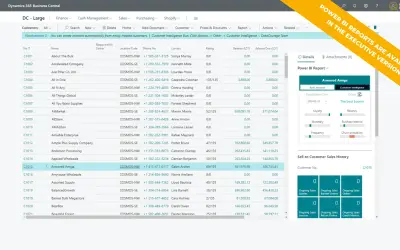
AI analysis app for Dynamics 365 Business Central that provides customer KPIs, churn probability, and customer grouping.
Data Courage«With the Enlighten Legend you can create independent interactive legends. Customise your marker shape and data colours. Set label formatting options including hover colours. The grid layout allows you to layout your legend how you choose. Custom sort ordering allows you to sort your legend according to your rules …»