Enlighten Aquarium
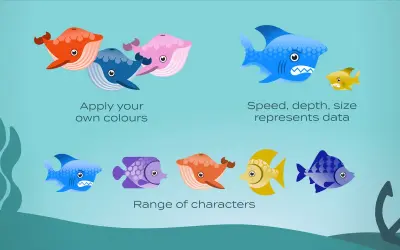
Displays Power BI data as sea creatures in an aquarium, making KPIs, rankings, and performance comparisons interactive.
ENLIGHTEN DESIGNSFreemiumCompare
7 apps
Displays Power BI data as sea creatures in an aquarium, making KPIs, rankings, and performance comparisons interactive.
ENLIGHTEN DESIGNS
Custom visual for Microsoft Power BI with per-bubble colour control, adjustable label fonts and sizes, and dynamic sizing.
ENLIGHTEN DESIGNS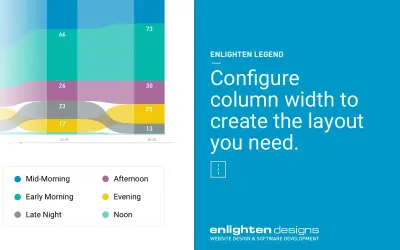
Enlighten Legend creates independent interactive legends with custom marker shapes, data colours, grid layouts, and sort ordering.
ENLIGHTEN DESIGNS
Filters Power BI reports interactively via a box-based slicer, with customizable colors, text sizes, and data highlighting.
ENLIGHTEN DESIGNS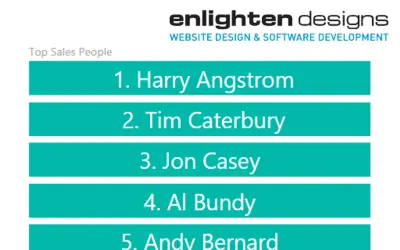
Enlighten Stack Shuffle is a Power BI custom visual that animates top data items as users explore and filter their data.
ENLIGHTEN DESIGNS