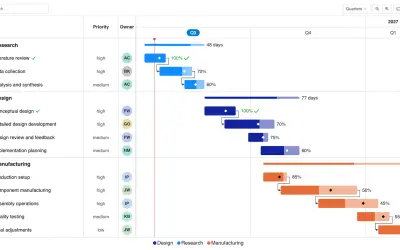
Gantt Chart
Gantt Chart is a project management visual for Microsoft Power BI that tracks schedules, milestones, and resource workloads.
ChartPadFree
Customize bubble colours, label fonts, label sizes, and bubble sizing in Power BI.
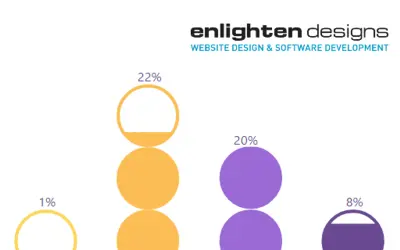
Provides a bubble stack visual for Power BI. It supports individual control of bubble colours, label fonts, and label sizes. Bubble sizing can be adjusted dynamically.
Sets bubble colours individually.
Controls label fonts individually.
Controls label sizes individually.
Adjusts bubble sizing dynamically.
657 plugins in Power BI · Analytics
Price distribution: 73 free, 108 freemium, 441 paid, 35 price not published
Gantt Chart is a project management visual for Microsoft Power BI that tracks schedules, milestones, and resource workloads.
ChartPad
Creates visualizations from diverse chart types, combines multiple charts on one canvas, and adds custom annotations and tooltips.
Akvelon
Creates financial and business reports in Power BI with automatic variance calculations, P&L logic, and drill-down (s5, s6).
Zebra BI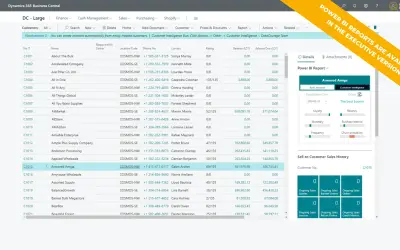
AI analysis app for Dynamics 365 Business Central that provides customer KPIs, churn probability, and customer grouping.
Data Courage«Enlighten Designs is a Microsoft-based innovation studio specializing in the art of telling data-driven stories to deliver exceptional customer value. Starting back in September 2016 when Microsoft revealed the ‘Power BI Best Visual’ contest and our Enlighten Aquarium won a people’s choice award, we received an …»