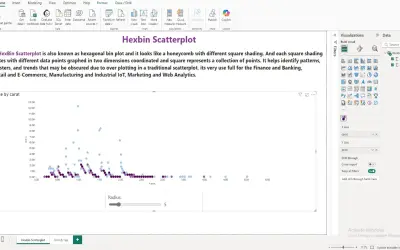
Hexbin Scatterplot by iFour
A Power BI visual that divides the data space into hexagonal bins to reduce overlap and visual clutter in large datasets.
iFour Technolab Pvt. Ltd.PaidCompare
1350 analytics apps for Microsoft 365
A Power BI visual that divides the data space into hexagonal bins to reduce overlap and visual clutter in large datasets.
iFour Technolab Pvt. Ltd.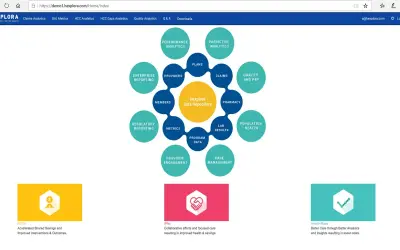
Hexplora delivers cloud-based data management, quality metrics, and predictive modeling for Azure and Power BI environments.
Hexplora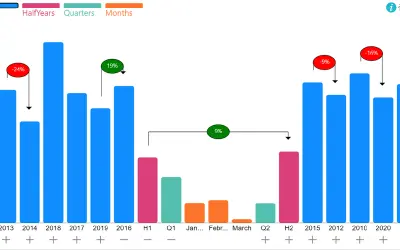
Power BI custom visual offering variance display, drag-based sorting, legend drill-down, and targets for hierarchical data.
Excelnaccess.com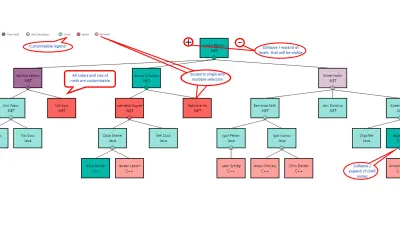
Hierarchy Chart by Akvelon displays hierarchical data such as organizational structures and genealogy within Power BI.
Akvelon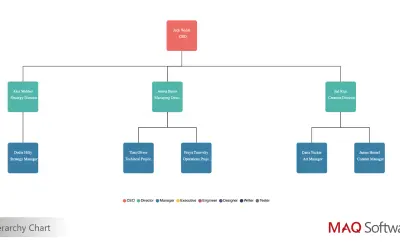
Hierarchy Chart by MAQ Software renders organizational and functional data as top-down tree diagrams with interactive cards.
MAQ LLC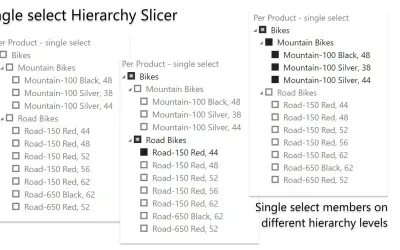
HierarchySlicer is a Power BI visual that filters report items using expandable or collapsible ad-hoc or pre-defined hierarchies.
DataScenarios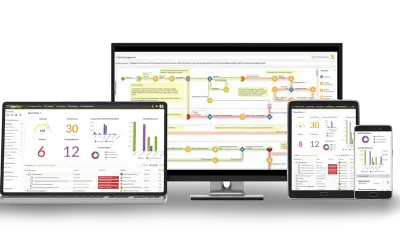
HighGear enables business users to assign tasks, manage work, and track progress in real-time across dozens of departments.
Swift Software, Inc.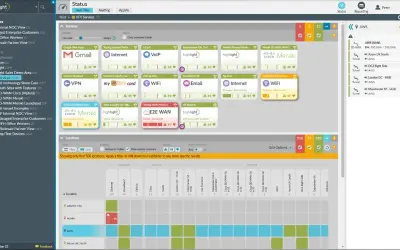
Highlight Service Assurance Platform provides visibility, alerting and reporting for multi-tenant, multi-vendor managed networks.
Highlight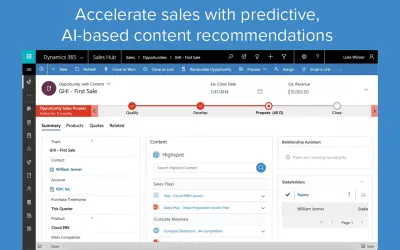
Highspot integration for Microsoft Dynamics 365 that recommends content, auto-logs activities, and provides training in-app.
Highspot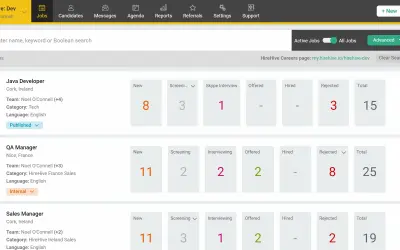
HireHive posts jobs to job boards and social channels, manages candidate pipelines, and translates application pages.
HireHive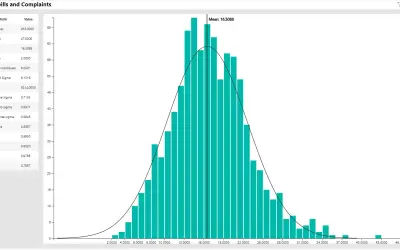
Histogram chart for Power BI that shows central location, spread, and shape of data along with capability indices.
PQ Systems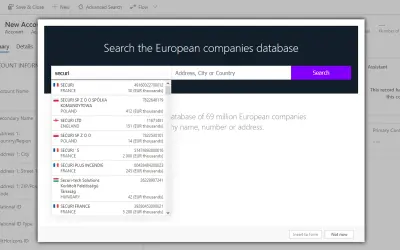
HitHorizons for Dynamics 365 enriches CRM records with data on over 80 million European companies via autofill and search.
FinStat s.r.o.
HIVERY Curate generates store-level category scenarios and space-assortment planograms for retail category management teams.
HIVERY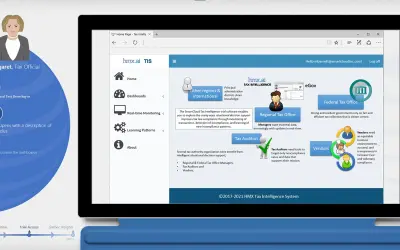
HMX TIS applies goal-directed situational reasoning in Microsoft Power BI to detect tax fraud and non-compliance patterns.
HMX.ai
HomebuilderONE gives homebuilding teams real-time visibility across projects, costs, schedules, and buyer activity.
saglobal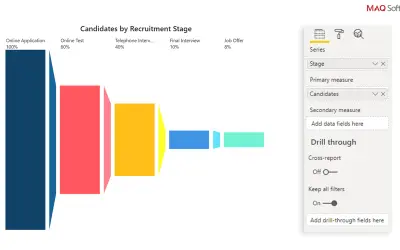
Horizontal Funnel by MAQ Software displays primary and secondary metrics across funnel stages in Power BI visuals.
MAQ LLC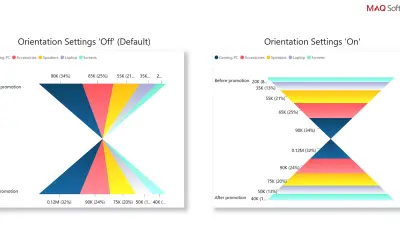
Hourglass Chart by MAQ Software compares category values between two scenarios as a custom visual for Power BI.
MAQ LLC
Uses NLP and machine learning to analyze Microsoft Outlook emails for sentiment, key phrases, entities, and PII.
Hourglass Software LLC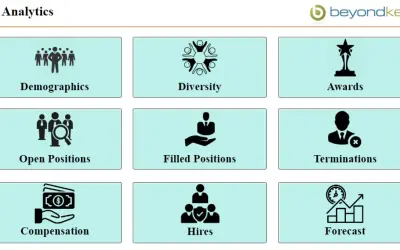
Provides curated Power BI dashboards for HR KPIs, including hiring, compensation, and diversity, with HRMS integration.
Beyond Key Systems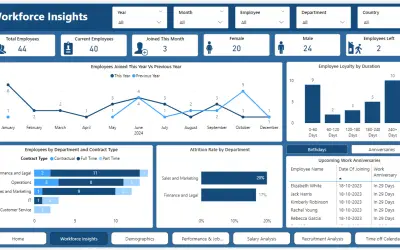
Power BI dashboard with real-time views of HR metrics such as headcount, attrition, recruitment, compensation, and leave.
Addend Analytics LLP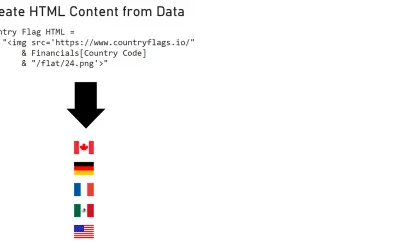
HTML Content (lite) renders dynamic HTML and Markdown in Power BI reports using a reduced tag set that meets certification rules.
Daniel Marsh-Patrick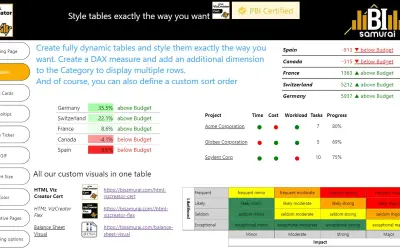
Builds custom visualizations, fully customized tables, bar charts, and KPI cards for Power BI, with PDF and PowerPoint export.
BI Samurai