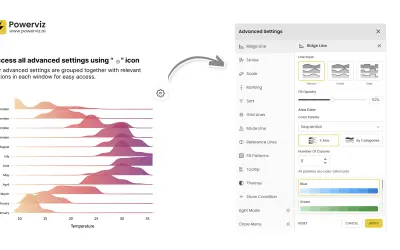
Ridgeline Plot by Powerviz
Custom Power BI visual that plots numeric distributions for multiple categories as stacked curves along a common continuous axis.
TRUVIZ INCFree
Adds a scatter chart to Power BI with X/Y measures, point size, saturation, filtering, and drill mode.
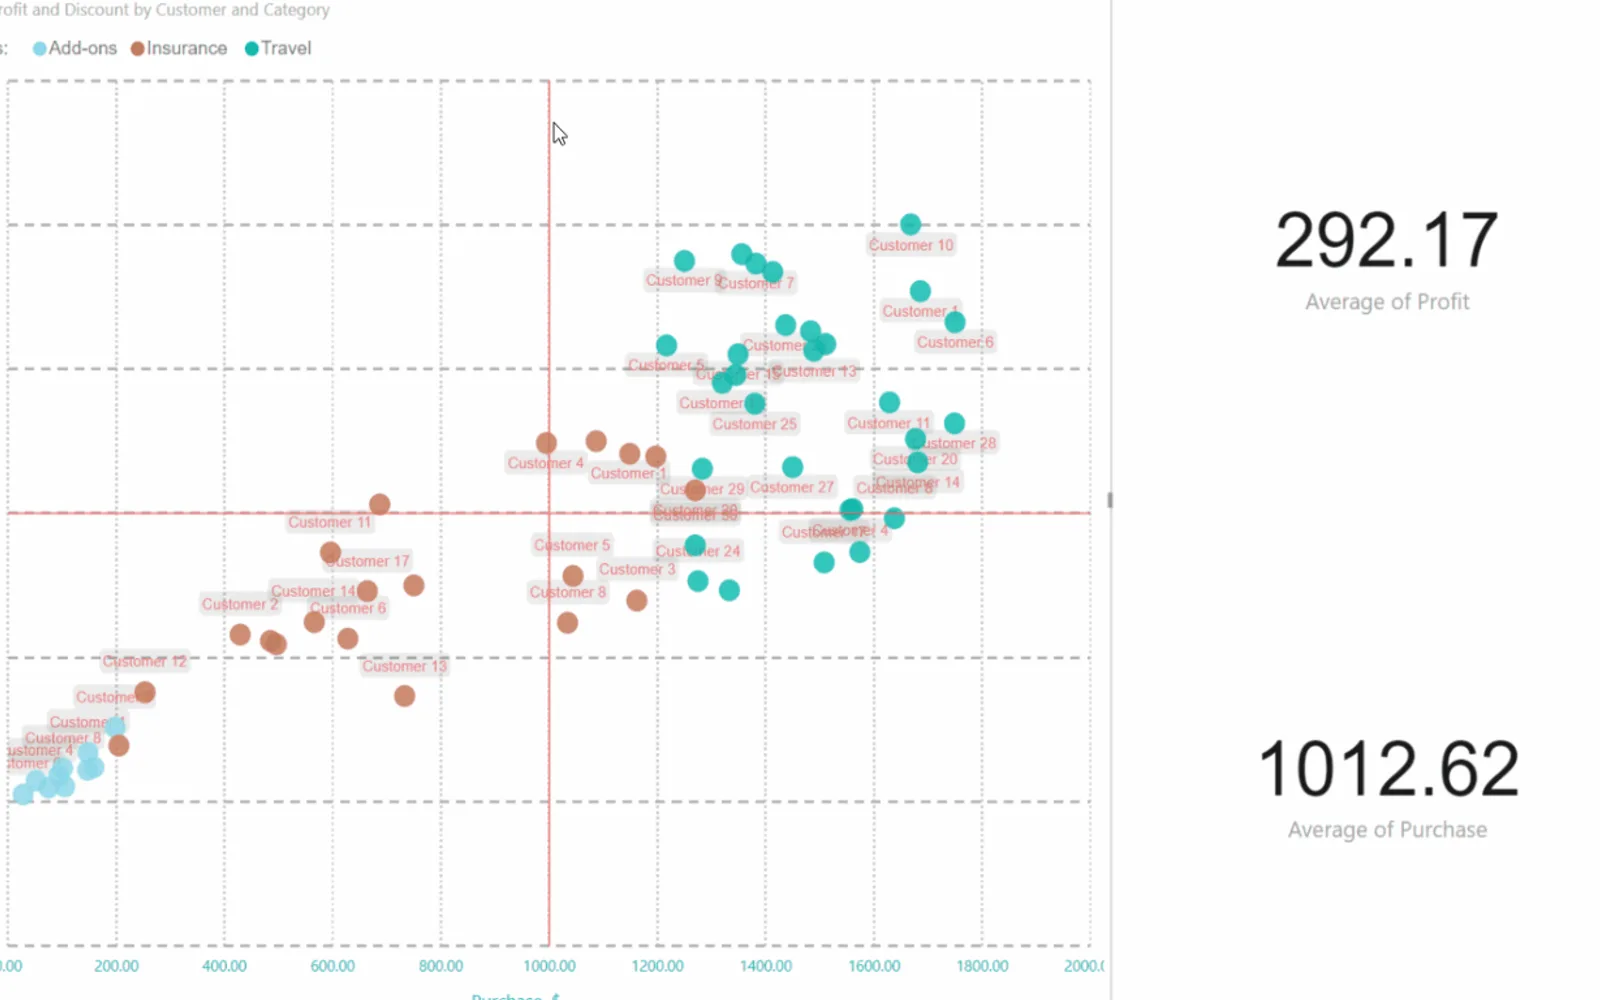
Scatter Chart by Akvelon displays data using X- and Y-axis coordinates, point size, and saturation. Rectangle selection filters multiple points within a selected area, and drill mode visualizes hierarchical data. It supports constant lines on both axes, selectable legends, category-specific point colors, and configurable selection styling. The visual can save the current selection state and includes a Play Axis feature.
Plots units using X- and Y-axis coordinates, point size, and saturation.
Selects multiple scatter points within a rectangle and filters the data.
Visualizes hierarchical data through drill mode.
Adds constant lines to the X and Y axes.
Provides a legend that supports selection.
Sets a specific point color for each legend category.
Adjusts the transparency of selected and unselected points and the selection rectangle color.
Saves the current selection state.
Scatter Chart by Akvelon is paid and cloud-deployed, while Ridgeline Plot by Powerviz is free and cloud-deployed. Scatter Chart by Akvelon is paid, whereas Multi Line Chart with Tooltips is also paid; both are cloud-deployed. Lollipop Column Chart and Dual Y-Axis Combo Chart (Standard) are freemium and cloud-deployed, while Scatter Chart by Akvelon is paid and cloud-deployed. Bubble Chart with Categorical Data (Pro) is freemium and cloud-deployed, compared with Scatter Chart by Akvelon at paid pricing and cloud deployment.
| Name | Pricing | Deployment | Updated |
|---|---|---|---|
| this plugin | Paid | Cloud | |
| Ridgeline Plot by Powerviz | Free | Cloud | |
| Multi Line Chart with Tooltips | Paid | Cloud | |
| Lollipop Column Chart | Freemium | Cloud | |
| Dual Y-Axis Combo Chart (Standard) | Freemium | Cloud | |
| Bubble Chart with Categorical Data (Pro) | Not in catalog | ||
657 plugins in Power BI · Analytics
Price distribution: 73 free, 108 freemium, 441 paid, 35 price not published
Custom Power BI visual that plots numeric distributions for multiple categories as stacked curves along a common continuous axis.
TRUVIZ INC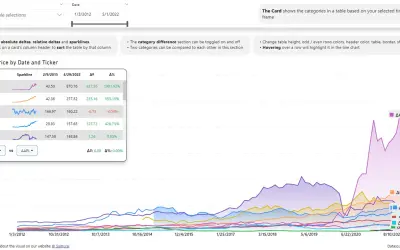
Power BI visual that compares categories over time, with YoY, MoM, YTD and MTD calculations, deltas and sparklines.
Datanauts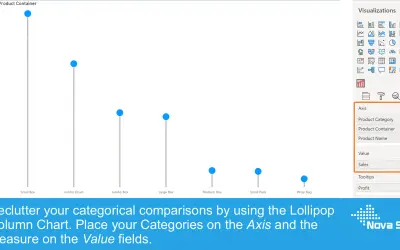
Lollipop Column Chart displays a marker and line per category as an alternative to standard column charts in Power BI.
Nova Silva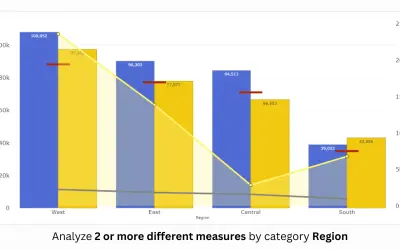
PBIVizEdit custom visual for Power BI that builds dual y-axis charts combining line, area, scatter, and column series.
PBIVizEdit.com«Scatter Chart by Akvelon is similar to other two-dimensional chart visuals and allows you to assess your units using multiple measures - X and Y axes coordinates, point size and saturation. Additionally it supports rectangle selection - such filtering allows to select multiple points of the scatter within rectangle …»