100% Stacked Column Chart by Akvelon
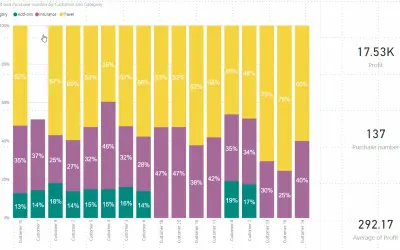
Plots 100% stacked column charts with rectangle selection and small multiple layouts for Power BI using category and value data.
AkvelonPaidCompare
9 apps
Plots 100% stacked column charts with rectangle selection and small multiple layouts for Power BI using category and value data.
Akvelon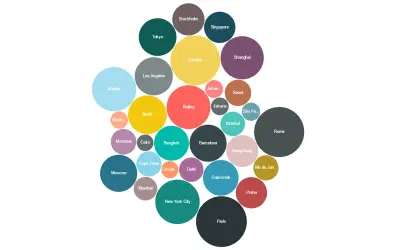
Bubble Chart by Akvelon is a Power BI visual that packs bubbles tightly to display more categories in a given space.
Akvelon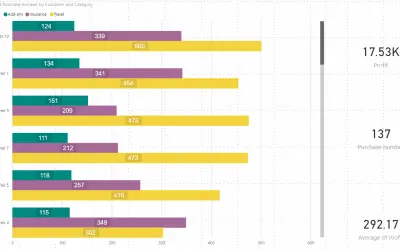
Clustered bar chart with rectangle selection to filter multiple bars, plus a selectable legend and per-category bar colors.
Akvelon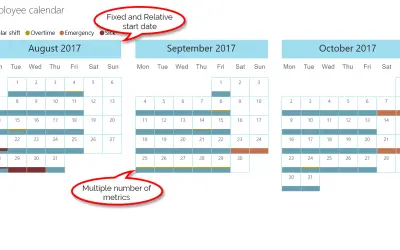
Custom calendar for Power BI that imports data from Excel, CSV, SQL, and more and shows each day's values as colored sections.
Akvelon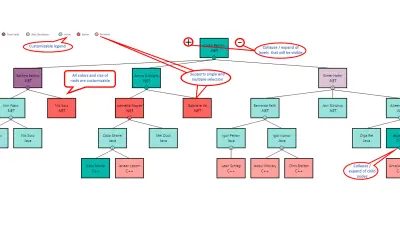
Hierarchy Chart by Akvelon displays hierarchical data such as organizational structures and genealogy within Power BI.
Akvelon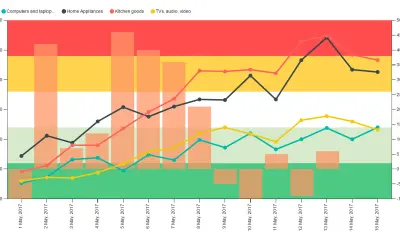
KPI Chart by Akvelon combines line and column charts with background KPI regions to analyze correlations between two measures.
Akvelon
Creates visualizations from diverse chart types, combines multiple charts on one canvas, and adds custom annotations and tooltips.
Akvelon