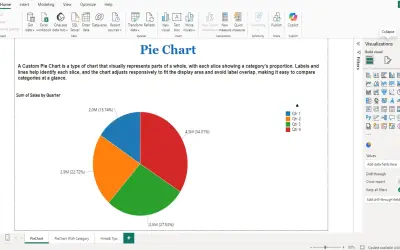
PieChart by iFour
PieChart by iFour divides data into colored slices to visualize parts-to-whole relationships within Power BI reports.
iFour Technolab Pvt. Ltd.Paid
Visualizes parts-to-whole data in Power BI with proportional ring slices, a central KPI, and a summary.
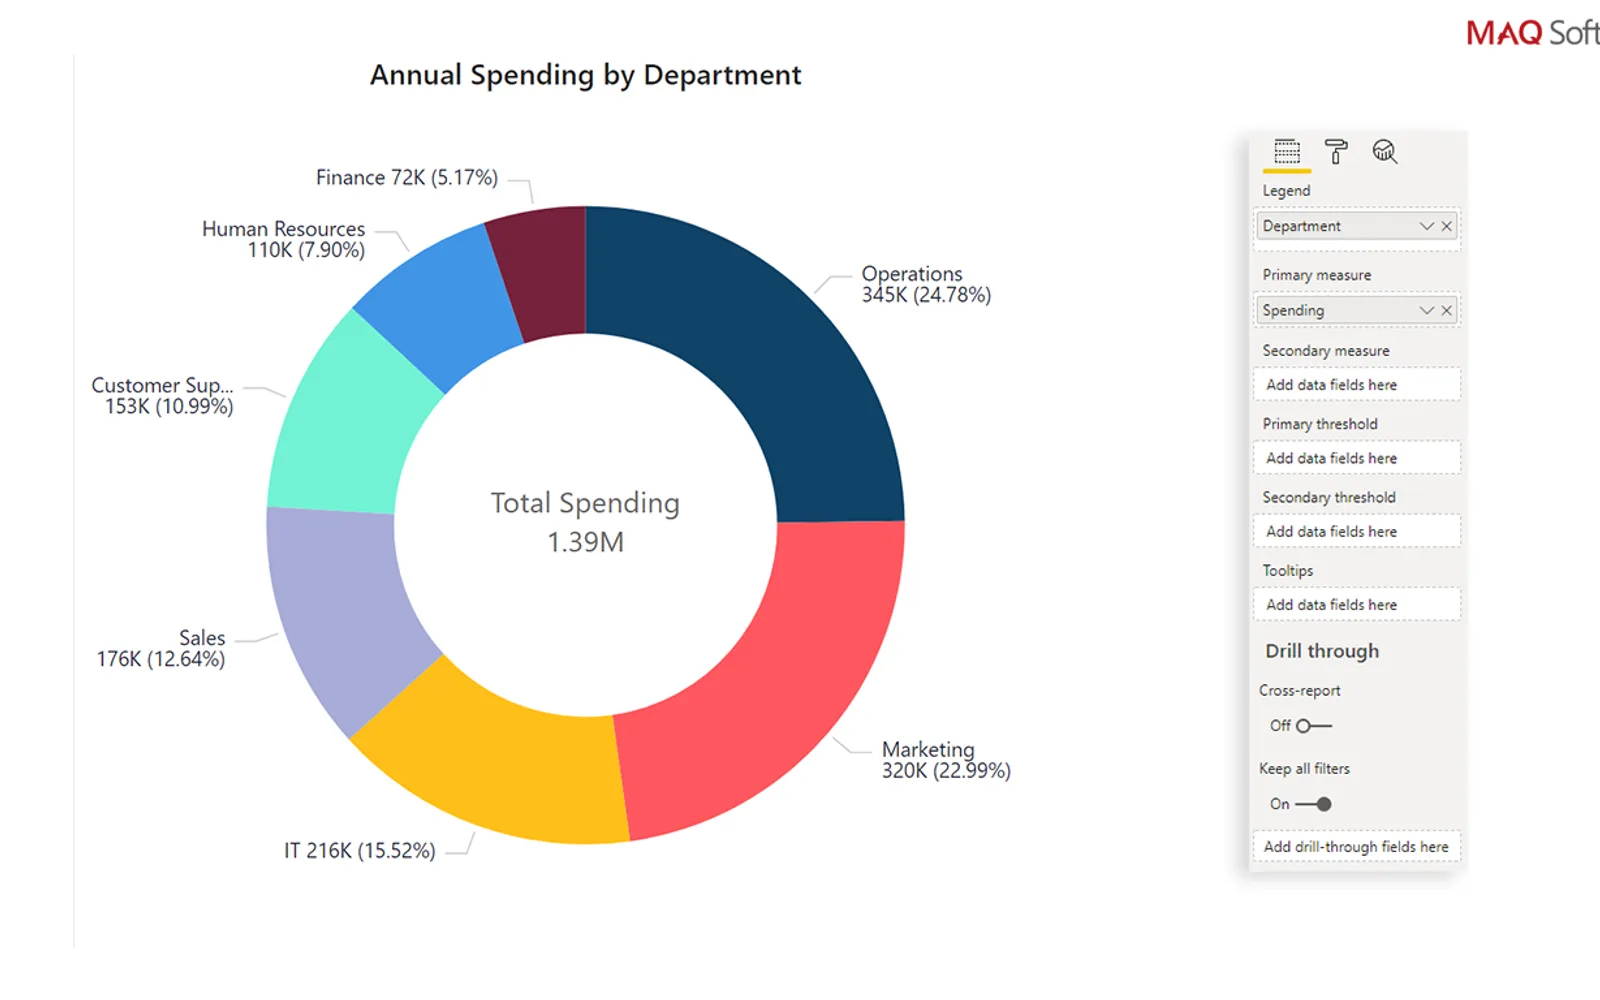
Ring Chart breaks totals into data slices whose sizes reflect their values. A central area displays a dynamic KPI and summary. The visual supports customizable legends, animation, positive and negative values, multi-field tooltips, bookmarks, and report tooltips.
Slice size corresponds to the related data value.
The ring center shows a dynamic KPI and summary.
The visual includes a customizable legend.
Tooltips can display multiple data fields.
The chart supports both positive and negative values.
The visual supports bookmarks.
Sales, marketing, and operations teams.
Ring Chart by MAQ Software is a paid cloud listing, as is PieChart by iFour and Progress Icon; Sunburst Chart and Advanced Pie and Donut - xViz are freemium, while Waffle Chart Maker is free. Ring Chart by MAQ Software was updated in May 2026, compared with Nov 2025 for PieChart by iFour and Dec 2025 for Sunburst Chart, Advanced Pie and Donut - xViz, and Waffle Chart Maker.
| Name | Pricing | Deployment | Updated |
|---|---|---|---|
| this plugin | Paid | Cloud | |
| PieChart by iFour | Paid | Cloud | |
| Progress Icon | Paid | Cloud | |
| Sunburst Chart | Freemium | Cloud | |
| Advanced Pie and Donut - xViz | Freemium | Cloud | |
| Waffle Chart Maker | Free | Cloud |
657 plugins in Power BI · Analytics
Price distribution: 73 free, 108 freemium, 441 paid, 35 price not published
PieChart by iFour divides data into colored slices to visualize parts-to-whole relationships within Power BI reports.
iFour Technolab Pvt. Ltd.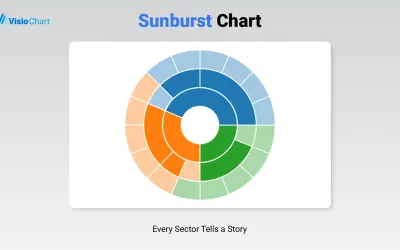
Displays up to five levels of hierarchical data as proportional segments across concentric rings in Power BI reports.
VisioChart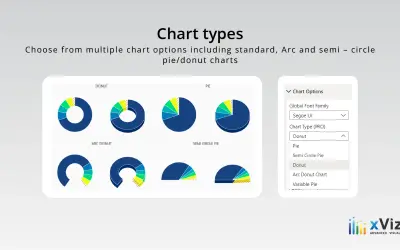
An xViz pie and donut chart for Power BI that compares parameters and displays each part's proportion of the whole.
xViz LLC dba Lumel
Power BI custom visual that fills an SVG icon to show KPI progress toward a target instead of a plain number on a card.
NeenOpal Inc«Ring Chart by MAQ Software breaks down large sums of data into smaller data slices. The size of each slice is relative to the data value. Ring Chart improves on the classic pie chart by providing an easy-to-read representation of your parts-to-whole data. The center of the ring displays a dynamic key performance …»