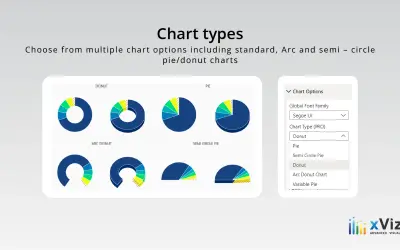
Advanced Pie and Donut - xViz
An xViz pie and donut chart for Power BI that compares parameters and displays each part's proportion of the whole.
xViz LLC dba LumelFreemium
Create Power BI bubble charts that compare three measures across four chart sections.
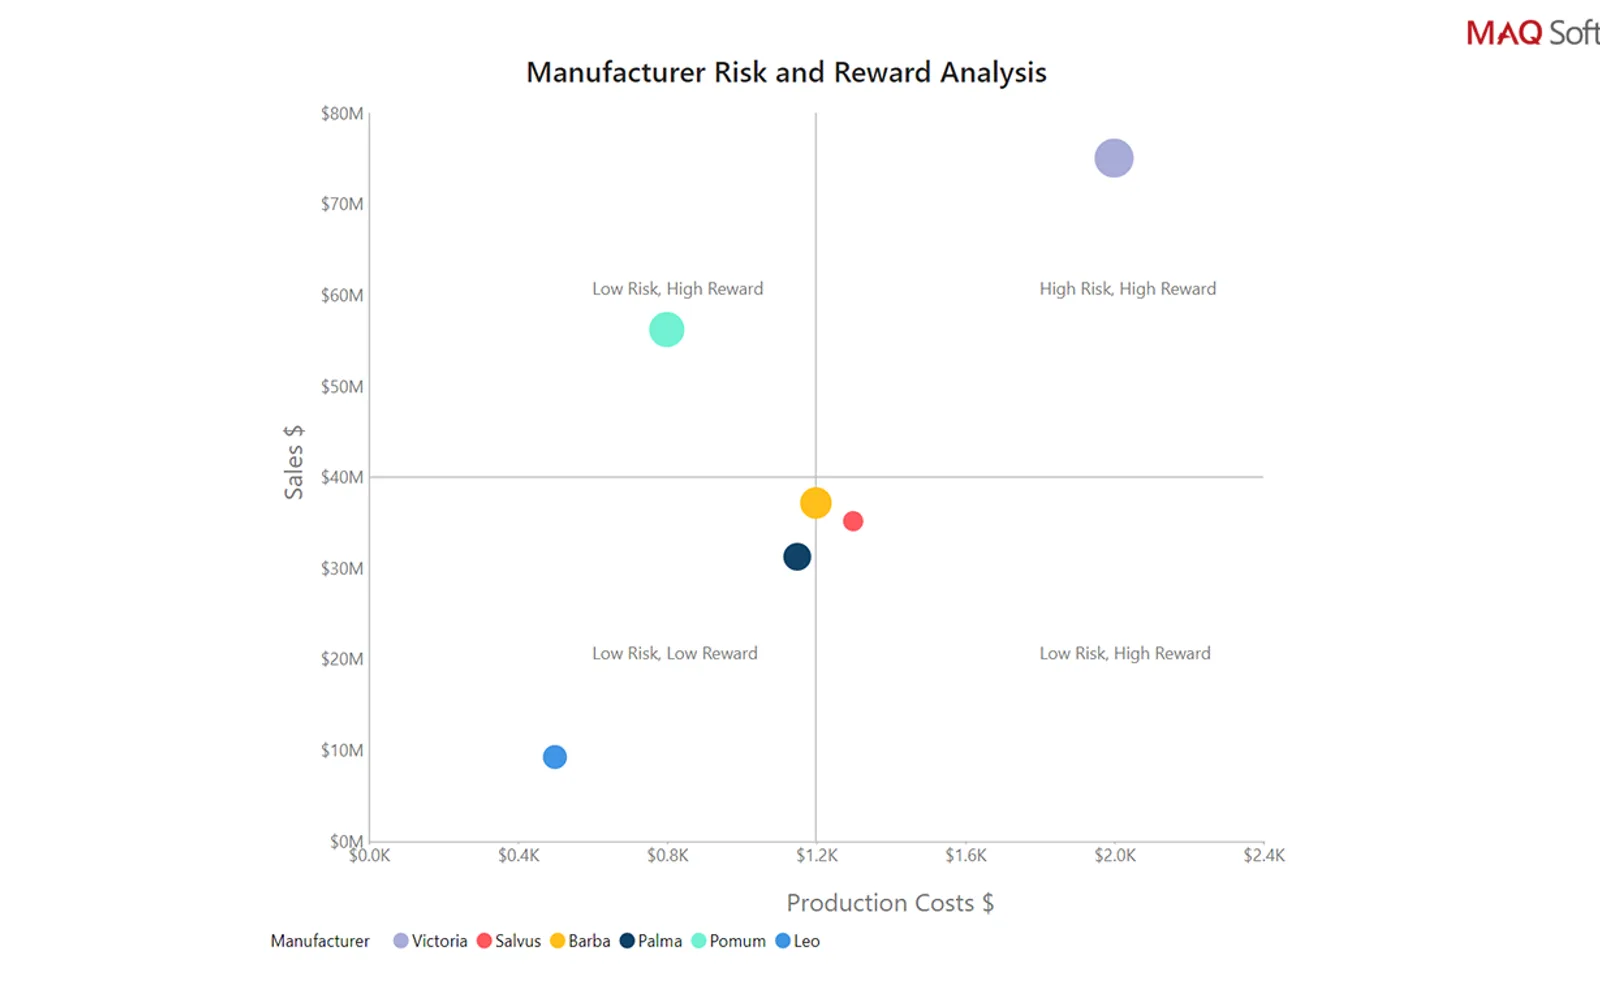
Adds a Power BI bubble chart for plotting three measures: X-axis position, Y-axis position, and bubble size. Titles, labels, display units, decimal points, bubble colors, and quadrant formatting can be customized. The visual supports a context menu.
Uses the X-axis, Y-axis, and bubble size to represent three measures.
Supports naming each of the four chart sections.
Provides options for customizing bubble colors.
Supports X-axis and Y-axis division lines with dotted or solid styling.
Provides settings for axis titles, labels, display units, and decimal points.
Supports a context menu.
Quadrant Chart by MAQ Software has a paid pricing model, while Advanced Pie and Donut - xViz, Sunburst Chart, Lollipop Column Chart, and Drill Down Network PRO (Pin) by ZoomCharts are freemium. Waffle Chart Maker is free. The listing and all five alternatives use cloud deployment.
| Name | Pricing | Deployment | Updated |
|---|---|---|---|
| this plugin | Paid | Cloud | |
| Advanced Pie and Donut - xViz | Freemium | Cloud | |
| Sunburst Chart | Freemium | Cloud | |
| Lollipop Column Chart | Freemium | Cloud | |
| Drill Down Network PRO (Pin) by ZoomCharts | Freemium | Cloud | |
| Waffle Chart Maker | Free | Cloud |
657 plugins in Power BI · Analytics
Price distribution: 73 free, 108 freemium, 441 paid, 35 price not published
An xViz pie and donut chart for Power BI that compares parameters and displays each part's proportion of the whole.
xViz LLC dba Lumel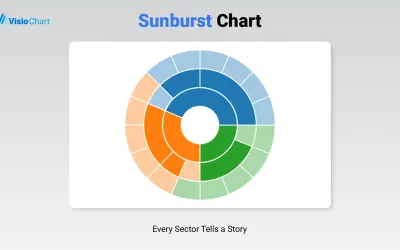
Displays up to five levels of hierarchical data as proportional segments across concentric rings in Power BI reports.
VisioChart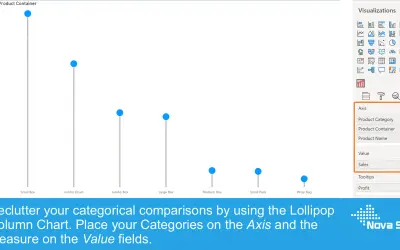
Lollipop Column Chart displays a marker and line per category as an alternative to standard column charts in Power BI.
Nova Silva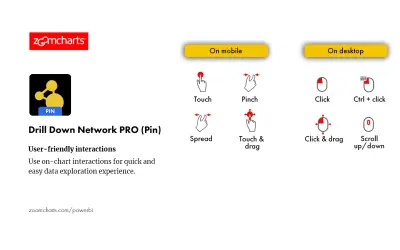
Drill Down Network PRO (Pin) by ZoomCharts renders interactive category-based network charts with drill-down support in Power BI.
ZoomCharts«Represent large quantities of information in a compact space. Quadrant Chart by MAQ Software is a bubble chart with a background divided into four equal sections. This visual is useful for plotting data that contains three measures using an X-axis, a Y-axis, and varying bubble sizes that represent the value of the …»