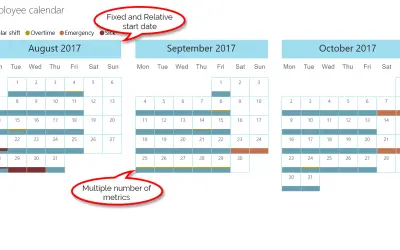
Custom Calendar by Akvelon
Custom calendar for Power BI that imports data from Excel, CSV, SQL, and more and shows each day's values as colored sections.
AkvelonPaid
Visualizes Power BI date data as colour-coded calendar events across month, week, day, and year views.
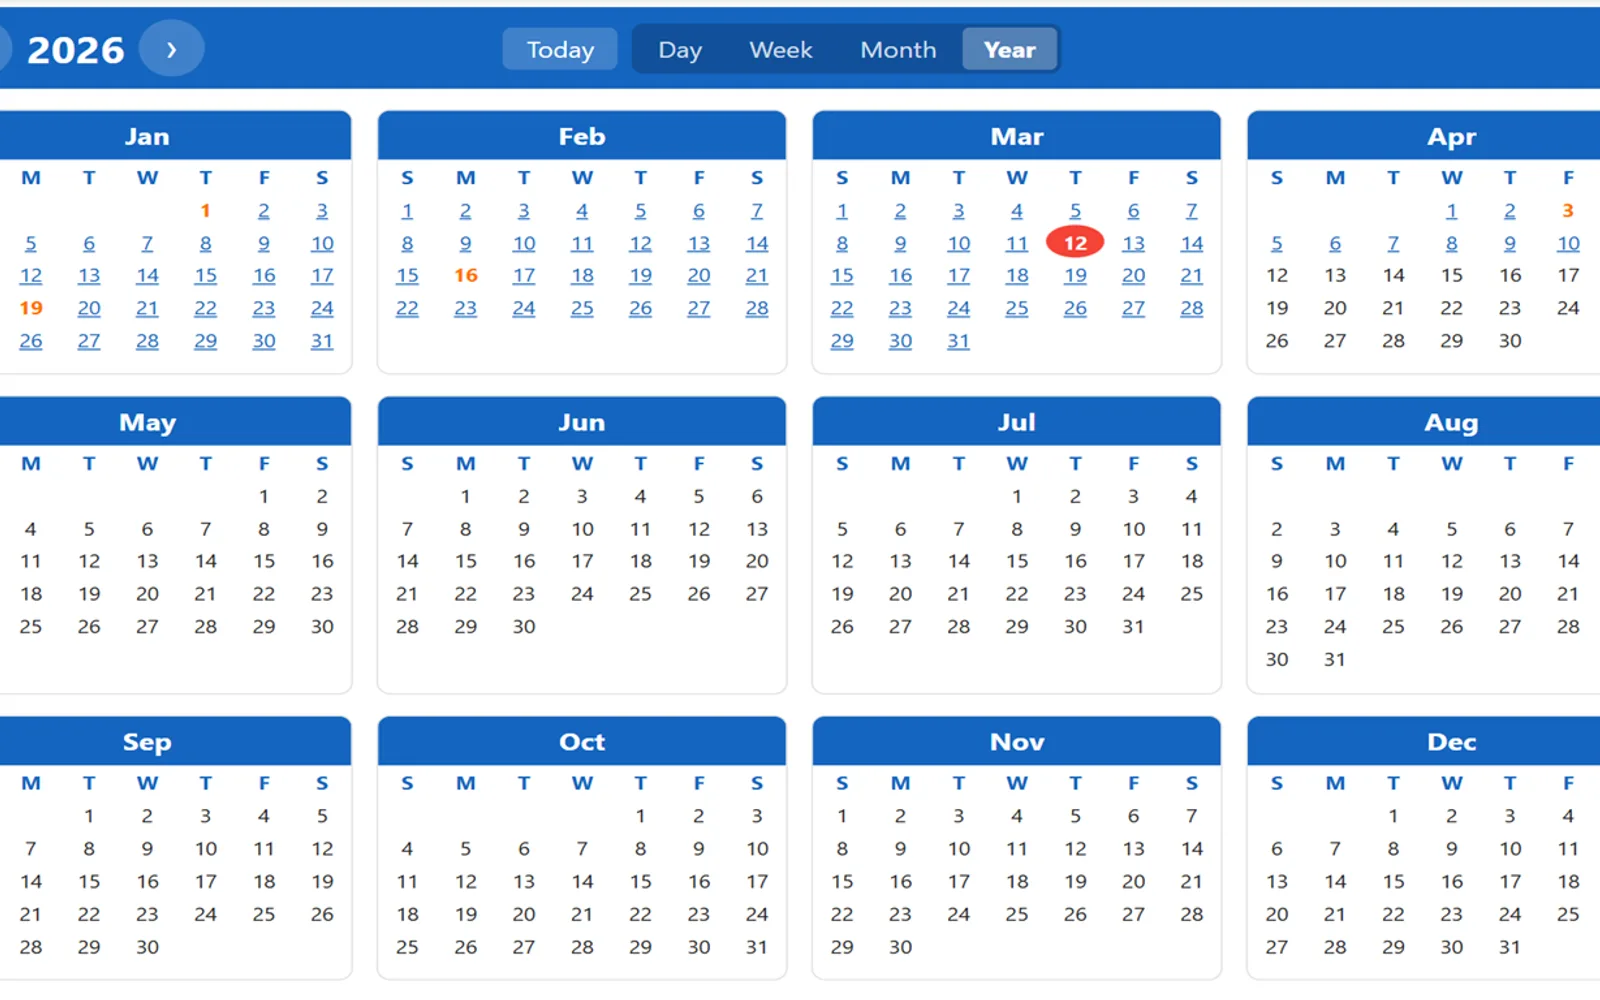
Maps date data in Power BI to event bars spanning their full duration. Displays calendar information in Month, Week, Day, and Year views with controls for period navigation, today highlighting, and weekend distinction. Groups and colour-codes events by category, displays holidays in eight styles, and supports cross-filtering with other Power BI visuals. Format pane settings configure the visual without code.
Displays events in Month, Week, Day, and Year views.
Shows events as colour-coded bars spanning their full duration.
Groups events by category and assigns colours to those groups.
Displays holidays using eight distinct styles.
Supports filtering between the calendar and other Power BI visuals through event selections, slicers, and tables.
Provides configuration options for visual elements through the Power BI Format pane.
Project managers, schedulers, and analysts.
Professional Calendar Visual, Custom Calendar by Akvelon, and Inforiver Super Filter are all paid cloud listings. Professional Calendar Visual was updated on Mar 2026, compared with Custom Calendar by Akvelon in Sep 2025 and Inforiver Super Filter in May 2026.
| Name | Pricing | Deployment | Updated |
|---|---|---|---|
| this plugin | Paid | Cloud | |
| Custom Calendar by Akvelon | Paid | Cloud | |
| Inforiver Super Filter | Paid | Cloud |
657 plugins in Power BI · Analytics
Price distribution: 73 free, 108 freemium, 441 paid, 35 price not published
Custom calendar for Power BI that imports data from Excel, CSV, SQL, and more and shows each day's values as colored sections.
Akvelon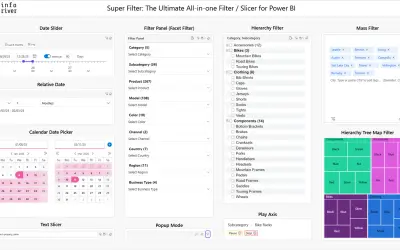
A free Power BI filter/slicer that consolidates multiple filters into a single panel, with mass filtering, presets, and search.
xViz LLC dba Lumel
Gantt Chart is a project management visual for Microsoft Power BI that tracks schedules, milestones, and resource workloads.
ChartPad
Creates visualizations from diverse chart types, combines multiple charts on one canvas, and adds custom annotations and tooltips.
Akvelon«The Professional Calendar Visual transforms your Power BI reports into a fully interactive project and event calendar. Map your date data to display events as colour-coded bars spanning their full duration across four view modes: Month, Week, Day, and Year. Navigate periods using built-in header controls, highlight …»