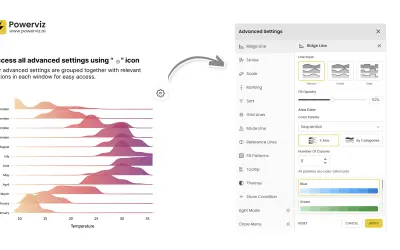
Ridgeline Plot by Powerviz
Custom Power BI visual that plots numeric distributions for multiple categories as stacked curves along a common continuous axis.
TRUVIZ INCFree
Power BI filter and slicer for date, categorical, hierarchical, measure, text, and bulk filtering.
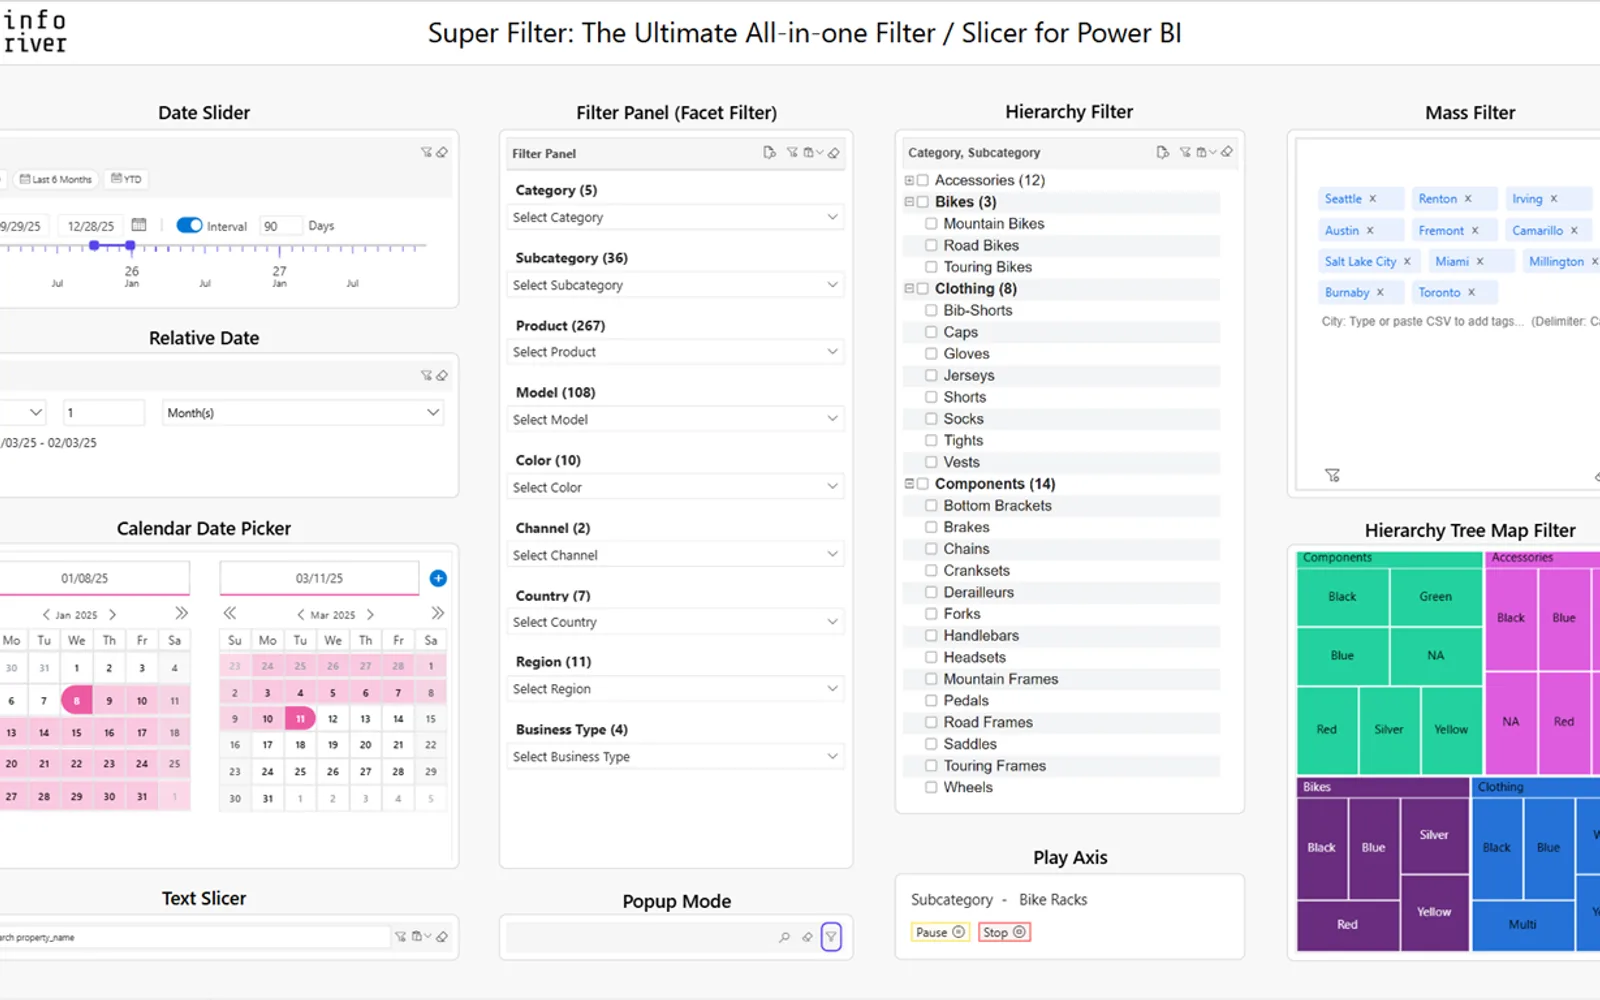
Inforiver Super Filter combines multiple filter and slicer types for Power BI. It provides date controls including sliders, calendar views, dynamic presets, fiscal-year support, and heatmaps. Other functions include hierarchy, treemap, measure, alphanumeric, search, mass, and operator-based filtering. The visual also supports saved filters, conditional formatting, sorting, ranking, popup mode, and several selector layouts.
Provides date sliders, calendar views, dynamic date presets, fiscal-year support, invalid-date and holiday marking, and heatmaps.
Provides an expandable tree view for filtering hierarchical data.
Filters categorical data by measure values within a specified range.
Supports bulk filtering by pasting values with multiple delimiters.
Allows frequently used filters to be preconfigured.
Highlights data points with color-coded rules and provides preset buttons for selecting values.
Provides options for sorting and ranking data.
Supports dropdowns, checkboxes, radio buttons, toggles, button tiles, and images.
Inforiver Super Filter is listed as paid and cloud-deployed, while Ridgeline Plot by Powerviz is listed as free and cloud-deployed. Inforiver Super Filter was updated on May 2026, while Ridgeline Plot by Powerviz was updated in Jul 2026. Inforiver Super Filter lists date, categorical, hierarchical, measure, search, mass, sorting, ranking, and layout features; no capabilities are stated for Ridgeline Plot by Powerviz.
| Name | Pricing | Deployment | Updated |
|---|---|---|---|
| this plugin | Paid | Cloud | |
| Ridgeline Plot by Powerviz | Free | Cloud |
657 plugins in Power BI · Analytics
Price distribution: 73 free, 108 freemium, 441 paid, 35 price not published
Custom Power BI visual that plots numeric distributions for multiple categories as stacked curves along a common continuous axis.
TRUVIZ INC
Gantt Chart is a project management visual for Microsoft Power BI that tracks schedules, milestones, and resource workloads.
ChartPad
Creates visualizations from diverse chart types, combines multiple charts on one canvas, and adds custom annotations and tooltips.
Akvelon
Creates financial and business reports in Power BI with automatic variance calculations, P&L logic, and drill-down (s5, s6).
Zebra BI«Inforiver Super Filter is the ultimate all-in-one FREE Power BI filter/slicer, combining date, categorical, hierarchical, measure filter & much more! Key Features: • Date Filter: • Date Slider - Filter date-based data with a visual scale for better context, fixed intervals for consistent period selection, customizable …»