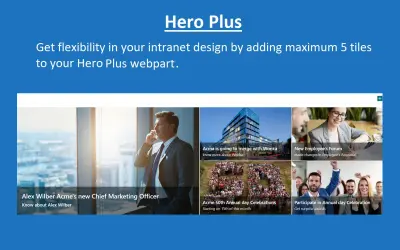
AQL Hero Plus
AQL Hero Plus adds visual links to documents, pages, and media in configurable layouts for SharePoint Online and Microsoft Teams.
AQL TechnologiesPrice not published
Builds tables and charts from SharePoint, Azure SQL, Excel, OData, and other sources for SharePoint pages and Teams tabs.
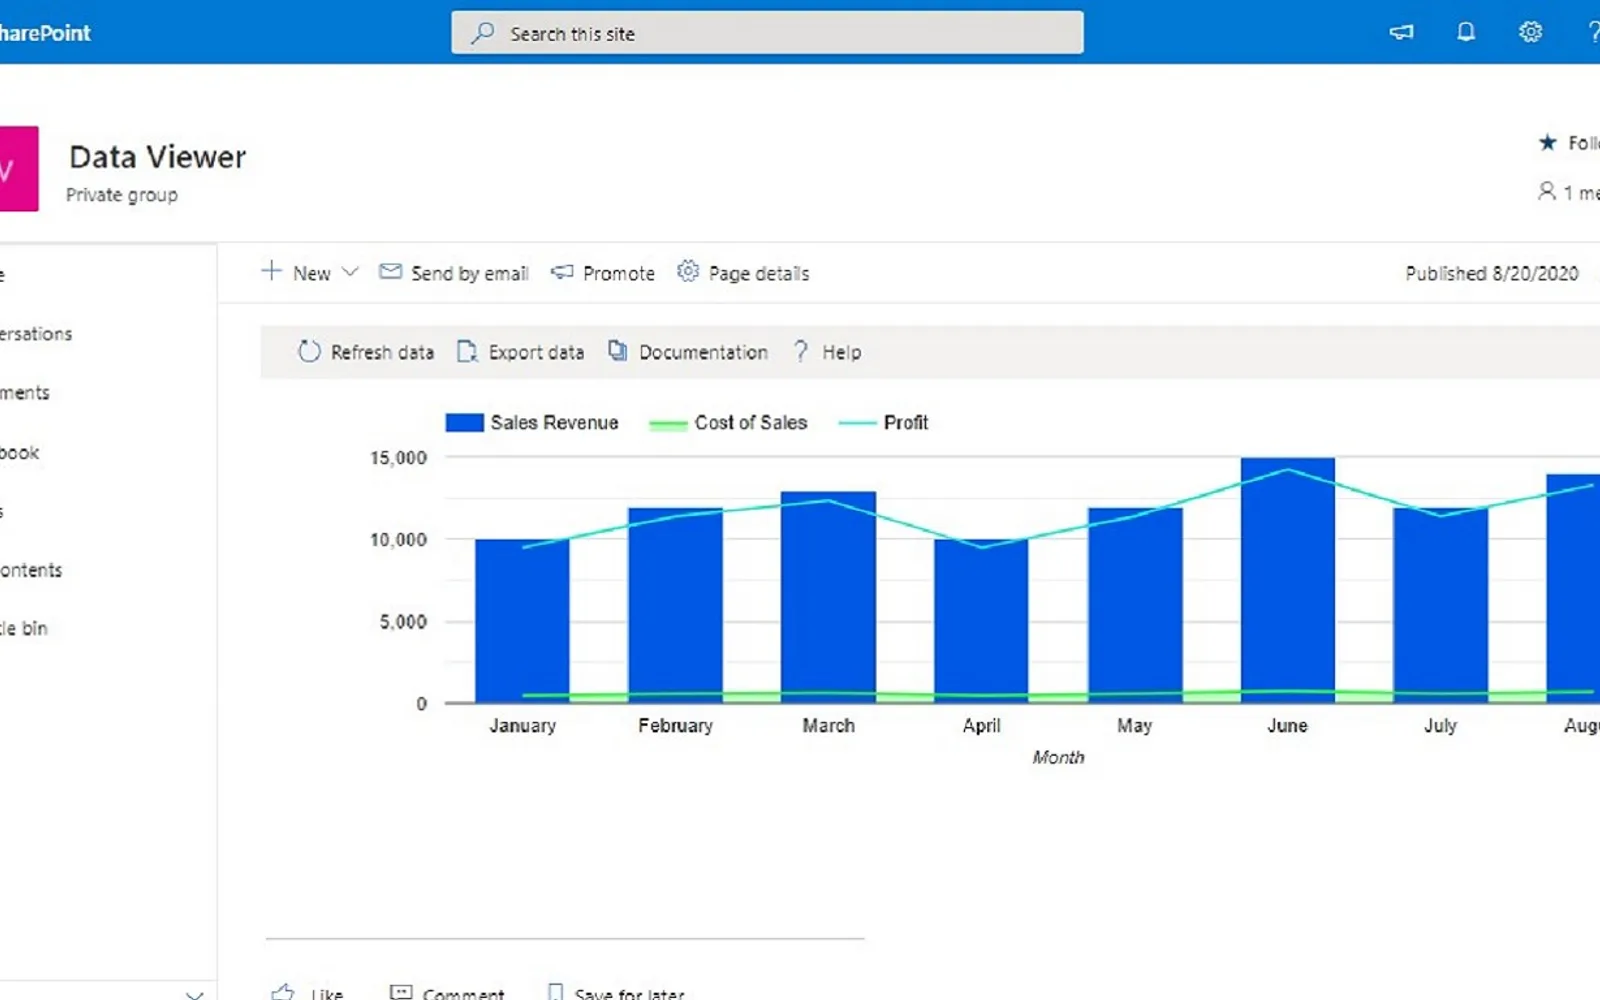
Creates list-style displays from content held in SharePoint, Azure SQL, Excel, OData services, connected web parts, and external sources. Displays can group columns, apply conditions, calculate aggregates, and format data. Chart options include pie, bar, column, line, and surface area formats. Users can configure these displays without code for SharePoint pages and Microsoft Teams tabs.
Shows source data in a SharePoint list view with grouping, conditional formatting, aggregate functions, and data formatting.
Displays data as pie, bar, column, line, or surface area charts.
Uses data from SharePoint, Azure SQL, Excel, OData services, connected web parts, and external sources.
Provides styling controls for data and chart views without requiring code.
Includes WebPart and AdaptiveCardExtension components for SharePoint Framework.
Business users of Microsoft SharePoint or Microsoft Teams.
Lightning Tools Data Viewer uses cloud deployment and has an unknown pricing model. Dual Y-Axis Combo Chart (Pro) for Power BI is cloud-deployed with freemium pricing, while 100% Clustered Stacked Bar Chart (Standard) is cloud-deployed with paid pricing. AQL Hero Plus, ThePoint MyApp Portal, and Sift also use cloud deployment with unknown pricing models.
| Name | Pricing | Deployment | Updated |
|---|---|---|---|
| this plugin | Price not published | Cloud | |
| Dual Y-Axis Combo Chart (Pro) for Power BI | Freemium | Cloud | |
| 100% Clustered Stacked Bar Chart (Standard) | Not in catalog | ||
| AQL Hero Plus | Price not published | Cloud | |
| ThePoint MyApp Portal | Price not published | Cloud | |
| Sift | Price not published | Cloud | |
1,293 plugins in SharePoint · Analytics
Price distribution: 34 free, 83 freemium, 427 paid, 749 price not published
AQL Hero Plus adds visual links to documents, pages, and media in configurable layouts for SharePoint Online and Microsoft Teams.
AQL Technologies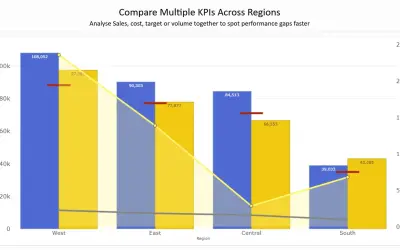
Combines column, line, area, and scatter charts on dual Y-axes to compare up to 8 metrics in a single Power BI visual.
PBIVizEdit.com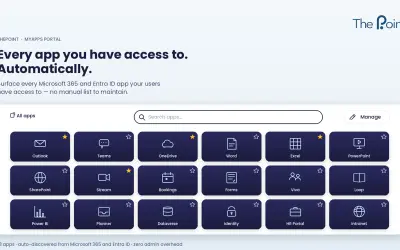
SharePoint web part that dynamically displays each signed-in user's assigned Microsoft Entra ID enterprise apps.
ThePoint
Sift provides an interactive org chart, employee profiles, and instant people search within Microsoft Teams and Outlook.
Sift, LLC«Business users of Microsoft SharePoint or Microsoft Teams will be able to build data views and charts on SharePoint list content, Azure SQL Database tables and views, Excel workbooks, OData services, Connected Web Parts and external data. Data views provide your data within a SharePoint list type view that contains …»