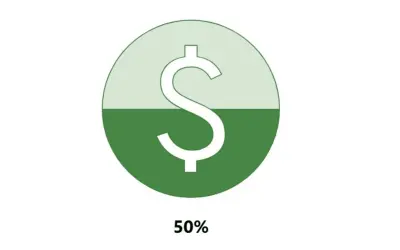
Progress Icon
Power BI custom visual that fills an SVG icon to show KPI progress toward a target instead of a plain number on a card.
NeenOpal IncPaid
Display Power BI KPIs as customizable animated gauge visuals with actual, target, minimum, and maximum values.
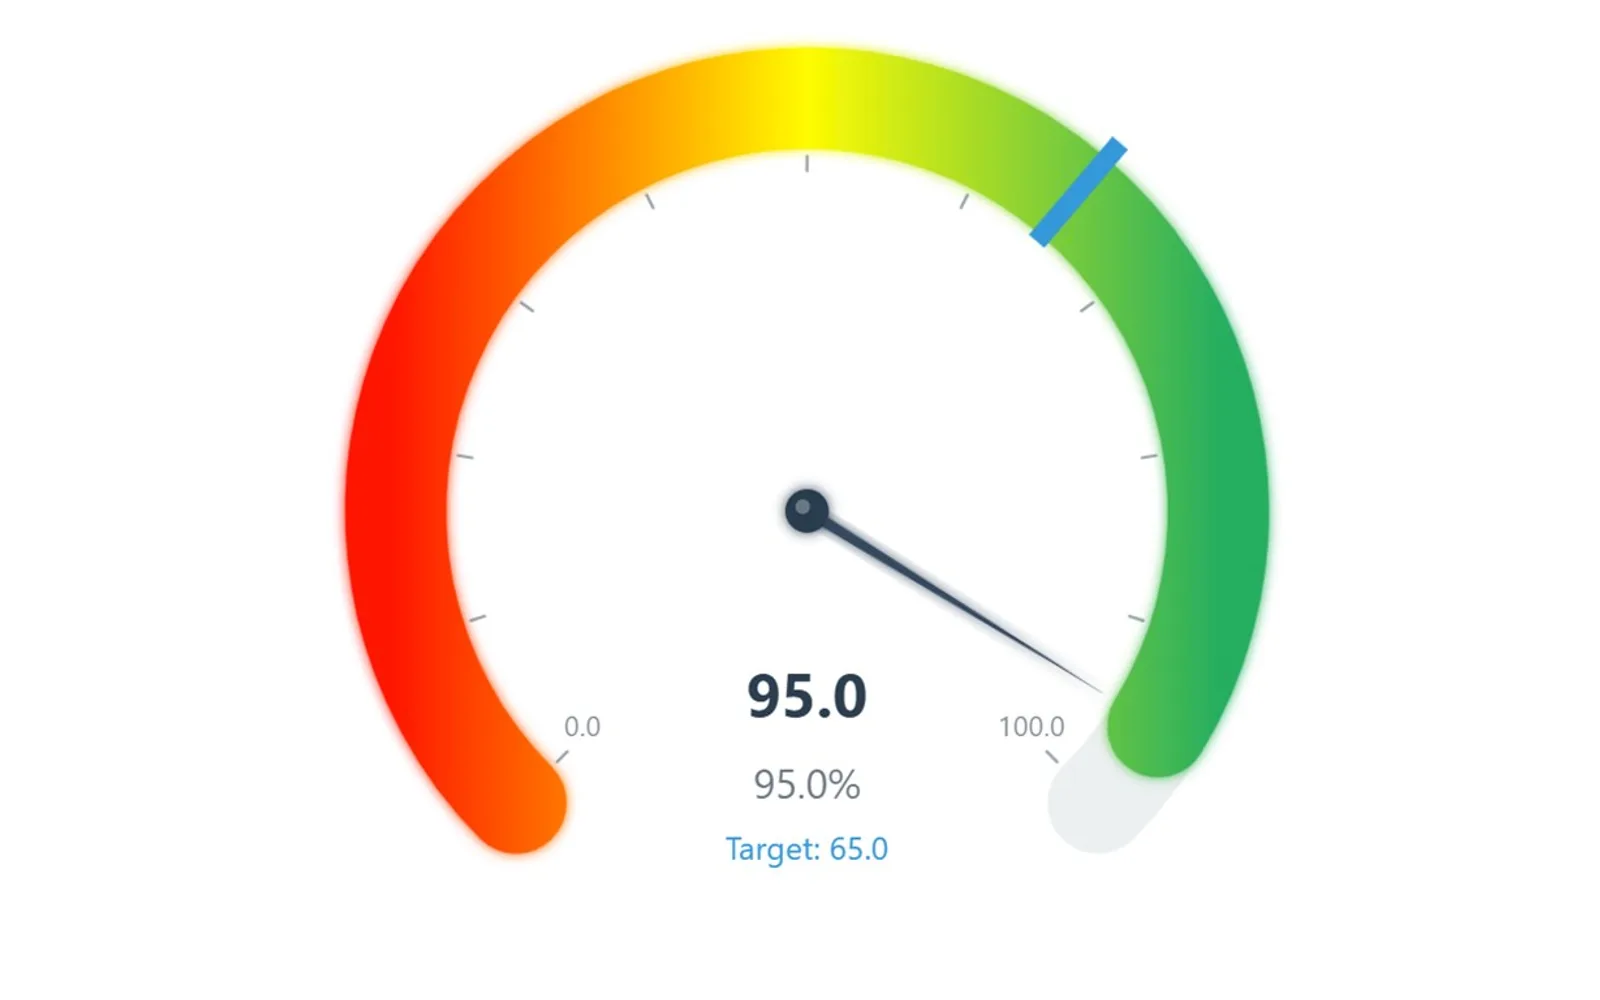
Displays Power BI key performance indicators as animated gauge visuals. The visual accepts measures, columns, whole numbers, decimals, percentages, and multiple data points. It can show actual values against target values, with optional minimum and maximum data fields. Labels, colors, fonts, angles, tick marks, and gauge styling can be configured.
Accepts measures, columns, whole numbers, decimals, percentages, and single or multiple data points.
Displays needle rotation with configurable animation or as a static report visual.
Shows a target line and actual-versus-goal comparison with configurable line styling and target formatting.
Provides controls for colors, gradients, fonts, gauge thickness, needle styling, angles, tick marks, and visual effects.
Can show value, target, percentage, minimum, and maximum labels with configurable precision, prefixes, suffixes, font size, and color.
Provides access to Power BI export and spotlight features from the context menu in desktop, web, and focus modes.
Speedometer-KPI and Progress Icon are paid cloud listings, while Bullet Chart - xViz is freemium and cloud deployed. Speedometer-KPI and Progress Icon were updated in 2026, while Bullet Chart - xViz was updated in Dec 2025. KPI Scorecard Report is a paid cloud listing updated in Nov 2024.
| Name | Pricing | Deployment | Updated |
|---|---|---|---|
| this plugin | Paid | Cloud | |
| Progress Icon | Paid | Cloud | |
| Bullet Chart - xViz | Freemium | Cloud | |
| KPI Scorecard Report | Paid | Cloud |
657 plugins in Power BI · Analytics
Price distribution: 73 free, 108 freemium, 441 paid, 35 price not published
Power BI custom visual that fills an SVG icon to show KPI progress toward a target instead of a plain number on a card.
NeenOpal Inc
Power BI visual for comparing actuals against targets, with IBCS-certified bullet chart templates and comparison bands.
xViz LLC dba Lumel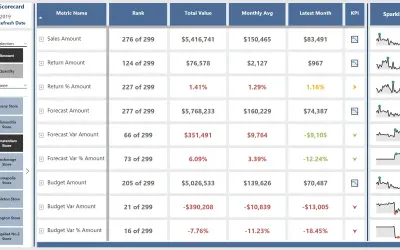
Lays out a grid of DAX measures across rows and columns using native and custom visuals to build a Power BI scorecard template.
Havens Consulting Inc
Gantt Chart is a project management visual for Microsoft Power BI that tracks schedules, milestones, and resource workloads.
ChartPad«Display your key performance indicators with style using the Speedometer KPI Visual - a professional, animated gauge that transforms raw numbers into engaging visual insights. KEY FEATURES: Data Flexibility - Accepts measures, columns, whole numbers, decimals, and percentages - Automatic percentage conversion (0.75 → …»