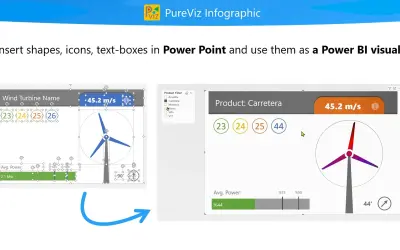
PureViz Infographic - for PowerPoint to Power BI
Imports PowerPoint-designed SVG graphics into Power BI and binds data to text, colors, and attributes of shapes.
IntellectBIPaid
Create tailored lists, bar charts, and column charts in Power BI with data-bound shapes, images, colors, and text.
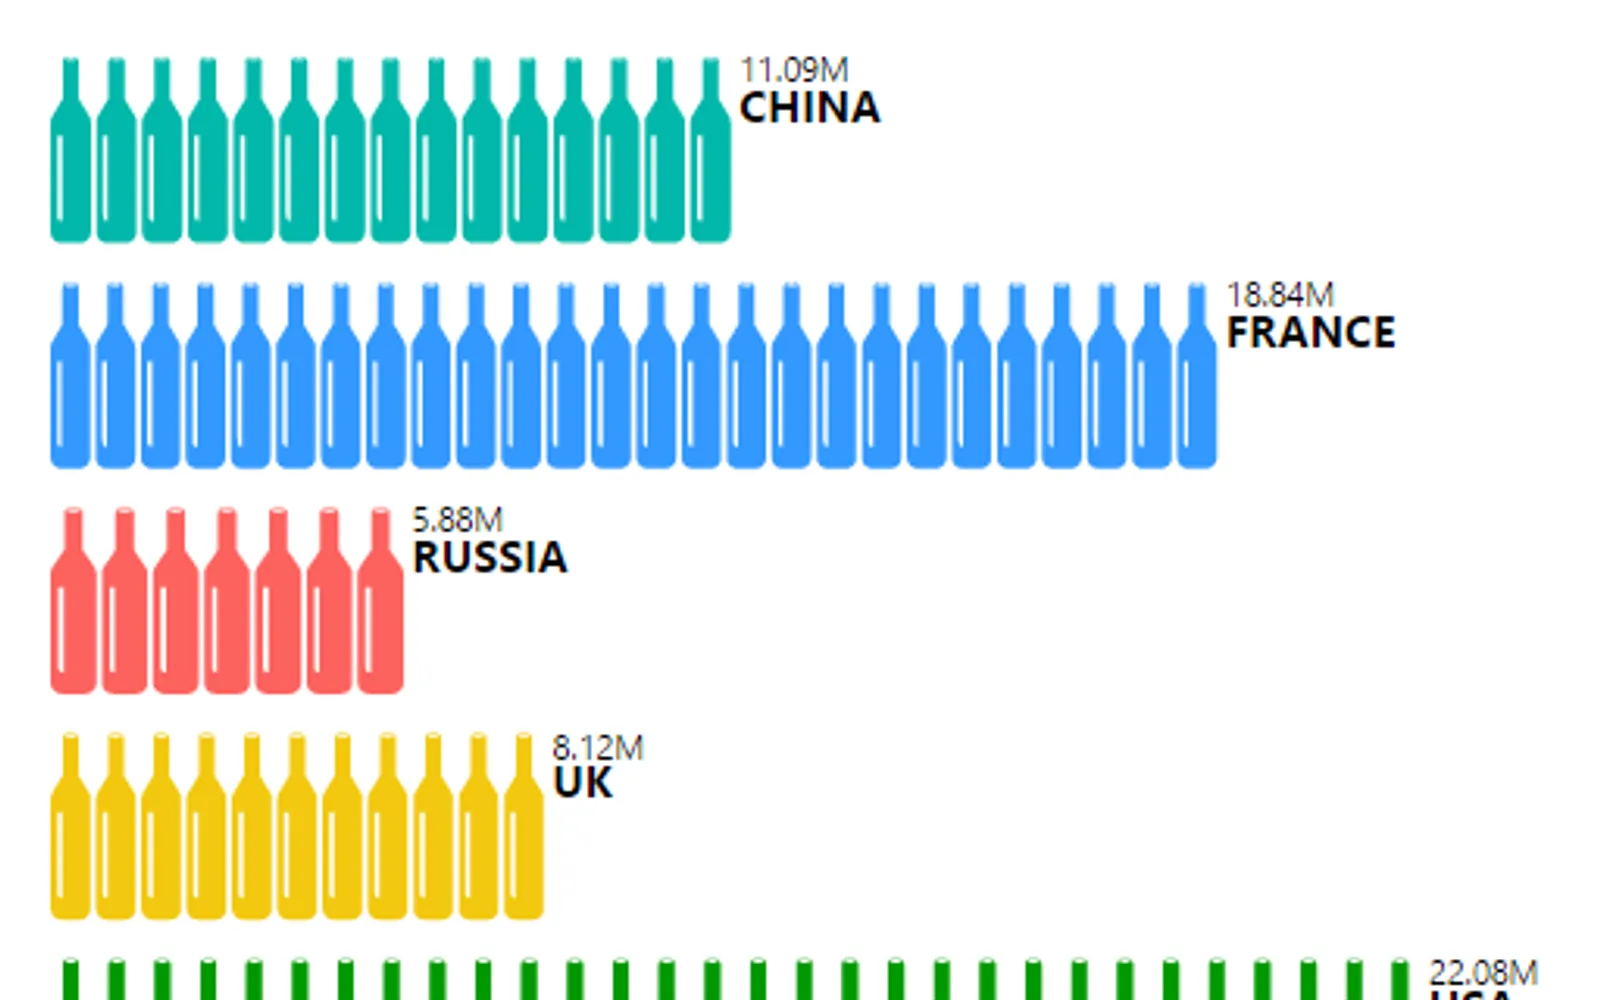
Infographic Designer controls the appearance and layout of lists, bar charts, and column charts in Power BI. It supports custom shapes, uploaded graphics, images, and text elements bound to data. Charts can use layered shapes, value-specific shapes, image fills, or tiled images to represent amounts and percentages. The editing experience includes options for layout, color, and graphic customization.
Bars and columns can use different shapes, including uploaded graphics.
Shapes and images can be bound to data.
Multiple shape layers and text elements can be added to a chart.
An image can show a color fill as a percentage of the total or tile to represent an amount.
The visual provides options for customizing layout and color.
657 plugins in Power BI · Analytics
Price distribution: 73 free, 108 freemium, 441 paid, 35 price not published
Imports PowerPoint-designed SVG graphics into Power BI and binds data to text, colors, and attributes of shapes.
IntellectBI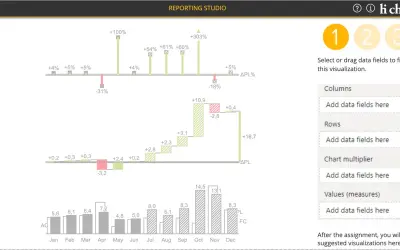
Creates charts, tables and waterfalls in Power BI with a built-in notation concept and automatic variance calculation.
CP Corporate Planning GmbH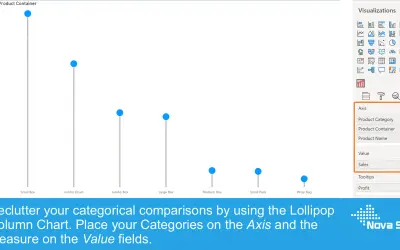
Lollipop Column Chart displays a marker and line per category as an alternative to standard column charts in Power BI.
Nova Silva
Gantt Chart is a project management visual for Microsoft Power BI that tracks schedules, milestones, and resource workloads.
ChartPad«Are you looking to tell a story with your data? Or have you ever wanted your charts and reports to be highly tailored to your specific topic? The infographic designer custom visual for Power BI gives you the flexibility to achieve this and more! The infographic designer custom visual lets you control the specific …»