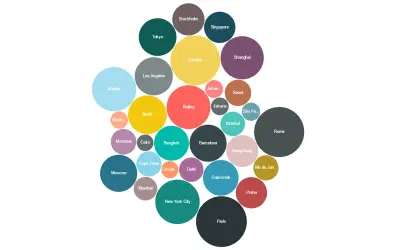
Bubble Chart by Akvelon
Bubble Chart by Akvelon is a Power BI visual that packs bubbles tightly to display more categories in a given space.
AkvelonPaid
Adds marker shapes, background images, and developer crosshairs to Power BI scatter charts.
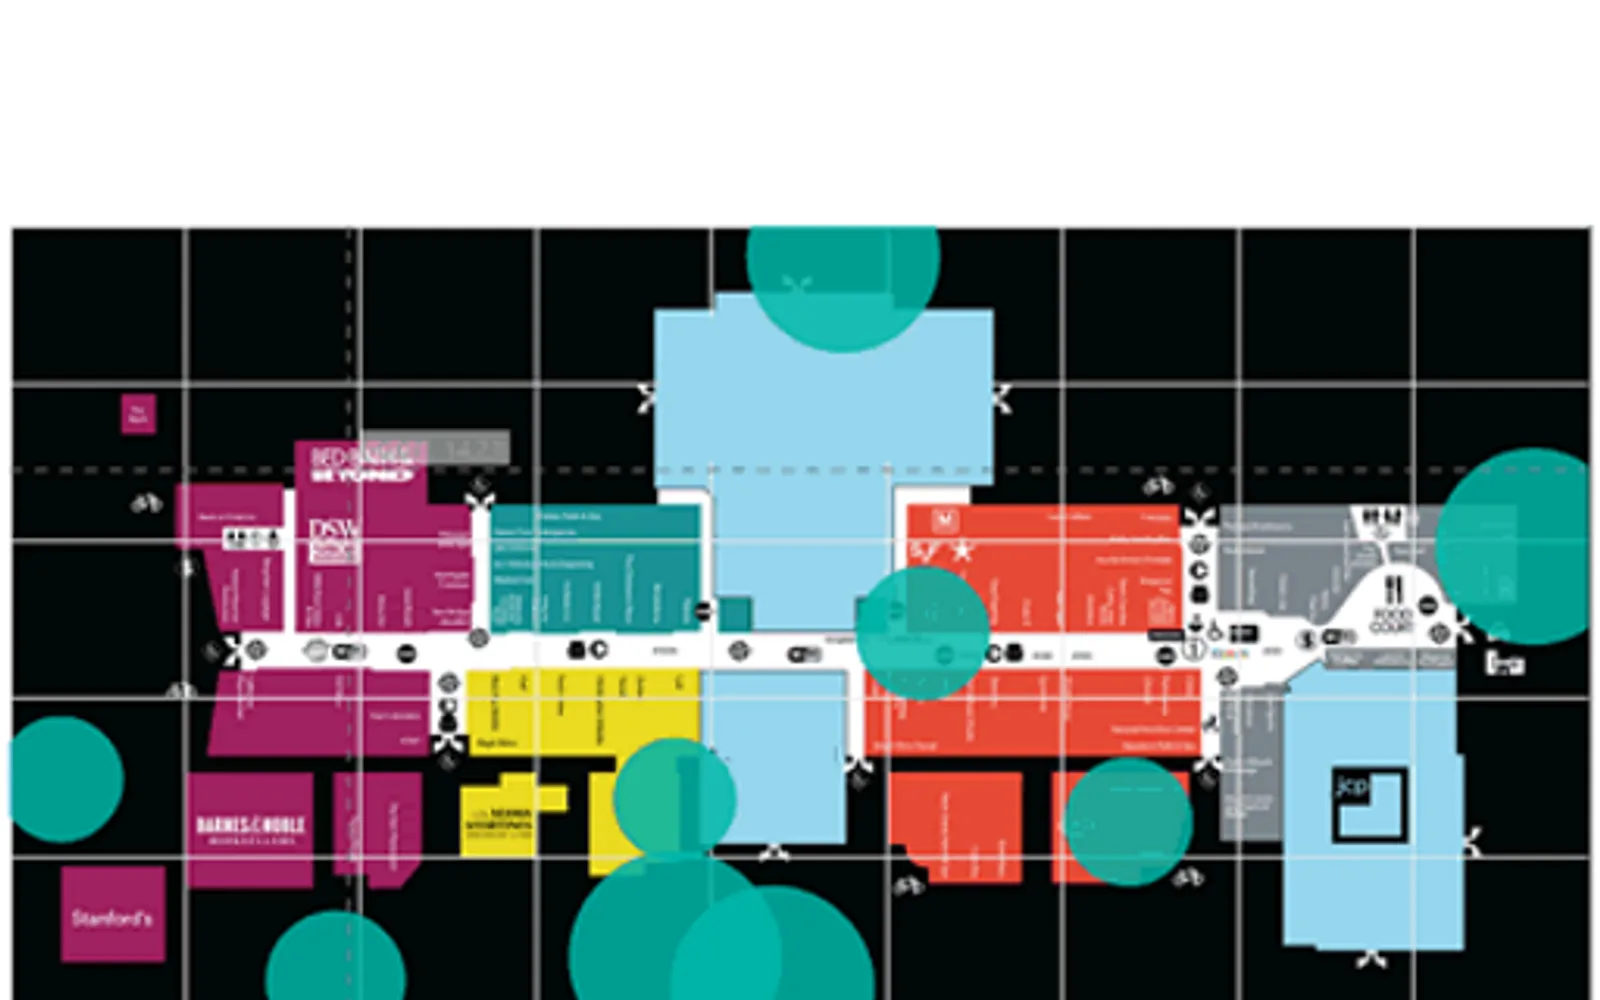
Adds properties to the existing scatter chart visual in Power BI. It supports shapes as markers and background images. Developer crosshairs support positioning elements on an image background. The visual is open source, with code available on GitHub.
Uses shapes as markers in the scatter chart visual.
Supports background images in the scatter chart visual.
Provides crosshairs for positioning elements on an image background.
51 plugins in GitHub · Analytics
Price distribution: 1 free, 2 freemium, 42 paid, 6 price not published
Bubble Chart by Akvelon is a Power BI visual that packs bubbles tightly to display more categories in a given space.
Akvelon
Gantt Chart is a project management visual for Microsoft Power BI that tracks schedules, milestones, and resource workloads.
ChartPad
Creates visualizations from diverse chart types, combines multiple charts on one canvas, and adds custom annotations and tooltips.
Akvelon
Creates financial and business reports in Power BI with automatic variance calculations, P&L logic, and drill-down (s5, s6).
Zebra BI«Enhanced Scatter introduces a few more properties that were added on top of the existing scatter chart visual, including shapes as markers, background image support, and developer crosshairs for positioning elements onto an image background. This is an open source visual. Get the code from GitHub …»