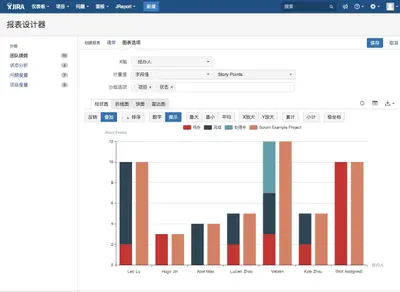
JReport - Reports and Charts for Jira
Create Jira reports, charts, and dashboard gadgets from project and issue data.
Shanghai Digital Talent Technology Co., Ltd.Paid
Organizes Jira Story work by group and member in dashboard tables and charts.
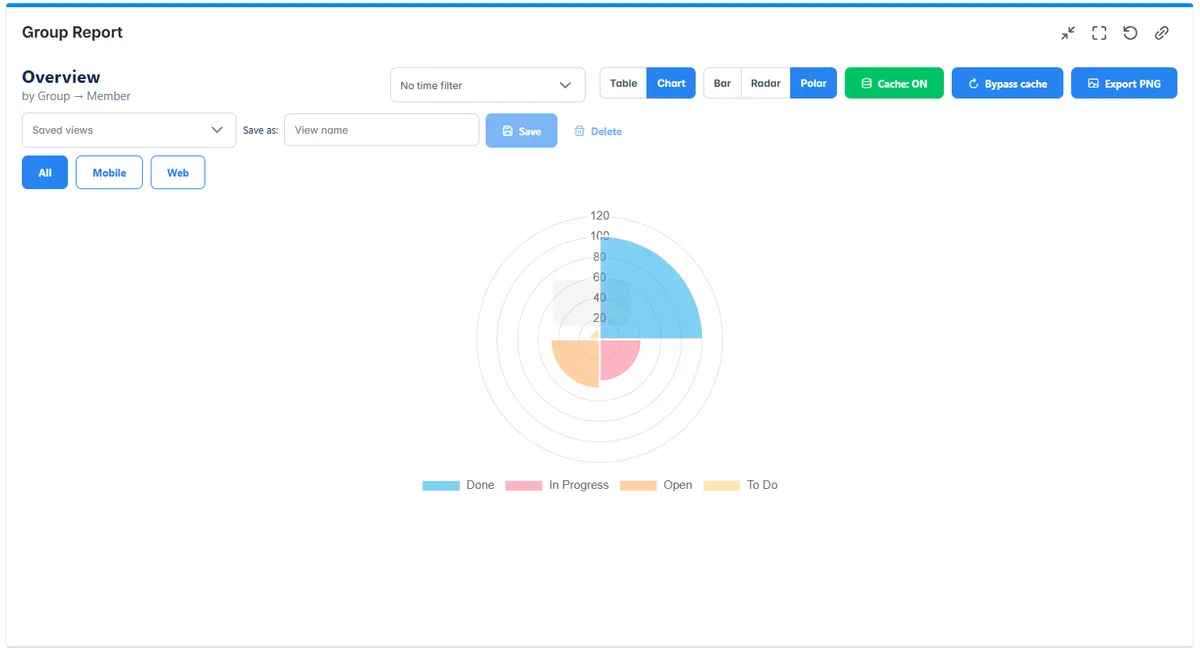
Group Report provides a view of Story workload by group and member in Jira dashboards. Members and their tasks can be expanded, and the report can switch between Stacked Bar, Radar, and Polar Area charts. Status counts open JQL, while filters can be applied by group and project category. The gadget also includes CSV/XLSX export, presets, WIP, and time-in-status views.
Shows how many tasks are under each status by group.
Allows members and their tasks to be expanded within the report.
Provides Stacked Bar, Radar, Polar Area, and 100% stacked charts.
Status counts can be clicked to open JQL.
Filters are available for group and project category.
Supports CSV and XLSX export.
General View includes saving filters.
Includes WIP and time-in-status views.
Group Report uses a freemium pricing model, while Simple Gantt & Roadmap Timeline Dashboard Gadget for Jira, Charts - Reports and Graphs for Jira Dashboard, and Numeric Custom Field Chart are free. All four listings use cloud deployment. Group Report was updated in Dec 2025, compared with Sep 2026 for Simple Gantt & Roadmap Timeline Dashboard Gadget for Jira and Charts - Reports and Graphs for Jira Dashboard, and Jul 2026 for Numeric Custom Field Chart.
| Name | Pricing | Deployment | Updated |
|---|---|---|---|
| this plugin | Freemium | Cloud | |
| Simple Gantt & Roadmap Timeline Dashboard Gadget for Jira | Free | Cloud | |
| Charts - Reports and Graphs for Jira Dashboard | Free | Cloud | |
| Numeric Custom Field Chart | Free | Cloud |
630 plugins in Jira · Data and analytics
Price distribution: 189 free, 230 freemium, 211 paid
Create Jira reports, charts, and dashboard gadgets from project and issue data.
Shanghai Digital Talent Technology Co., Ltd.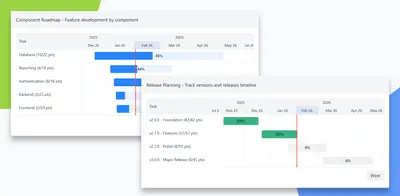
Creates Jira Gantt charts and roadmap timelines from work items, with configurable grouping and progress tracking.
Agilis LT (Simple Reports)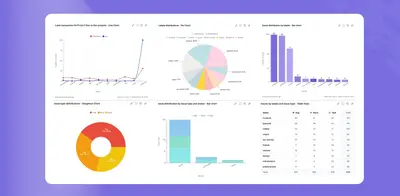
Create Jira dashboard charts and reports from issue data using multiple visual formats and filters.
Yamuno Software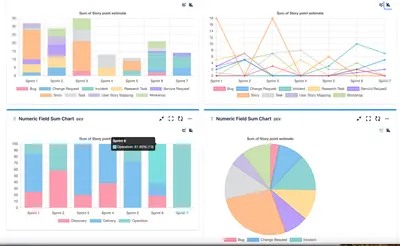
Create Jira dashboard charts and tables from numeric custom fields, grouped by dates, sprints, issues, epics, assignees, or other fields.
erin«Group Report gives a clear, actionable view of Story workload by Group → Member. Expand to see members and their tasks, or switch to charts (Stacked Bar, Radar, Polar Area). Click status counts to open JQL. Filter by group and project category. Built for Jira Cloud performance (cursor pagination, batched calls, slim …»