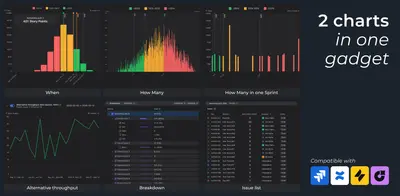
Monte Carlo simulations for Scrum/Kanban (Agile Gadgets)
Forecasts Scrum and Kanban delivery dates, scope completion, and capacity with Monte Carlo charts in Jira.
Broken BuildFreemium
Analyze Jira issue flow with probabilistic forecasts, control charts, inflow sensitivity, and cycle-time distributions.
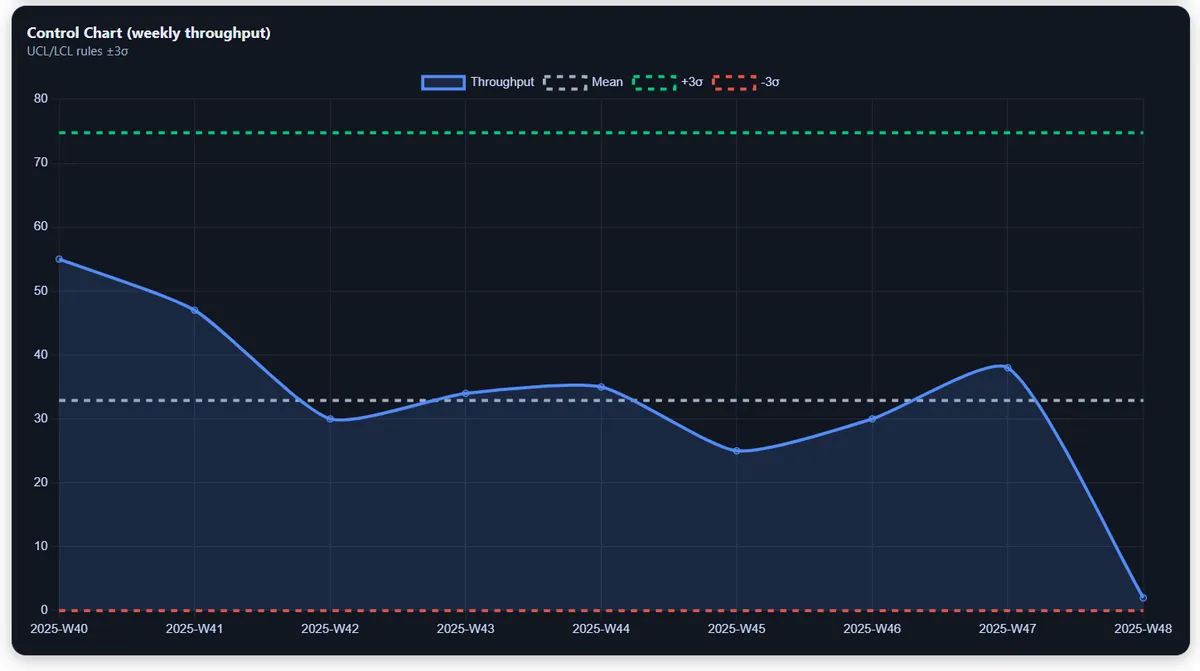
Task Flow Simulator adds flow-based analytics and probabilistic forecasting to Jira dashboards using Jira issues and historical throughput. It supports questions about completion dates, date feasibility, and required capacity without exporting data to spreadsheets. Control Chart Anomaly checks whether delivery data falls within a statistical band, while Inflow Sensitivity tests how changes in incoming work affect finish time. The SLA / Cycle Time distribution shows completed issues by the number of days between creation and resolution, with bars linking to the matching Jira issues.
Uses Jira issues and historical throughput to forecast flow-based delivery outcomes.
Checks whether the system is statistically stable by showing points outside a control band.
Tests how an increase in incoming work affects the time needed to finish.
Groups completed issues by the number of days between Created and Resolved.
Opens the Jira issues associated with a selected cycle-time bucket.
Task Flow Simulator is a freemium cloud add-in updated in Nov 2025. Monte Carlo simulations for Scrum/Kanban (Agile Gadgets) is also freemium and cloud, was updated in Sep 2026. Monte Carlo simulations for Jira (Agile Charts Reports KPIs) is paid, deployed in data-center, and was updated in Sep 2026. Agile Charts & Gadgets: Reports, Graphs, KPIs on Dashboard is paid and supports cloud, server, and data-center deployment.
| Name | Pricing | Deployment | Updated |
|---|---|---|---|
| this plugin | Freemium | Cloud | |
| Monte Carlo simulations for Scrum/Kanban (Agile Gadgets) | Freemium | Cloud | |
| Monte Carlo simulations for Jira (Agile Charts Reports KPIs) | Paid | Data Center | |
| Agile Charts & Gadgets: Reports, Graphs, KPIs on Dashboard | Paid | Cloud · Data Center · Server |
630 plugins in Jira · Data and analytics
Price distribution: 189 free, 230 freemium, 211 paid
Forecasts Scrum and Kanban delivery dates, scope completion, and capacity with Monte Carlo charts in Jira.
Broken Build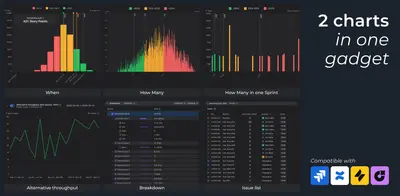
Forecast Jira delivery dates, scope, and capacity with Monte Carlo charts in a dashboard gadget.
Broken Build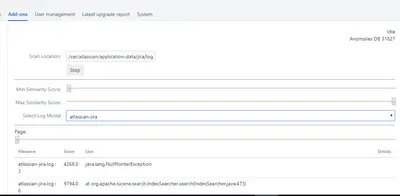
Anomaly detection for Jira.
Hutuleac Iulius
Analyze Jira delivery, sprint, flow, forecasting, and cycle-time data with reports and dashboard gadgets.
Broken Build«Task Flow Simulator brings modern flow-based analytics and probabilistic forecasting to Jira dashboards. Using your own Jira issues and historical throughput, it helps you answer practical questions like “When will we finish?”, “Can we hit this date?”, and “How much capacity do we need?” – without exporting data to …»