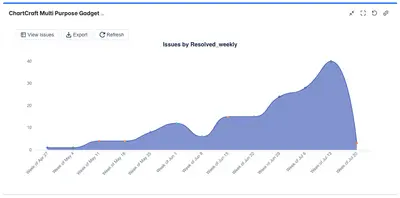
ChartCraft for Jira
Build Jira dashboards with charts, workflow metrics, custom-field analysis, and PNG or CSV exports.
White SoftwareFreemium
Create Jira dashboard charts and tables from numeric custom fields, grouped by dates, sprints, issues, epics, assignees, or other fields.
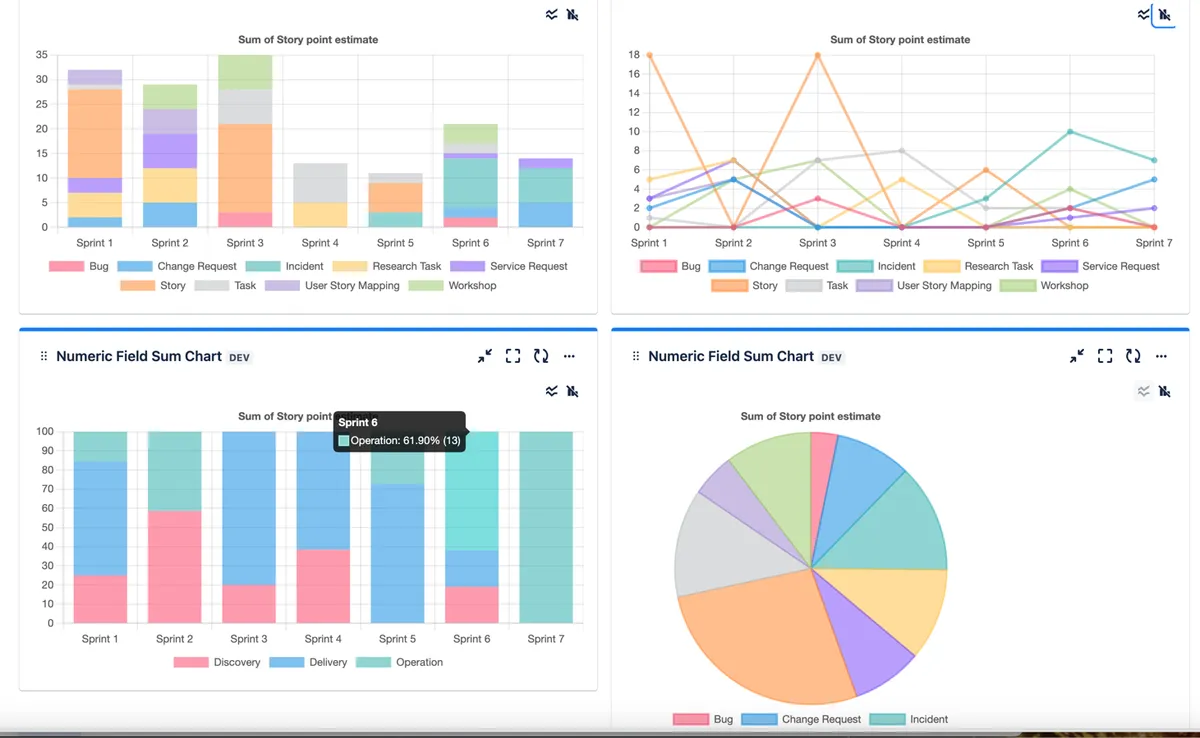
Aggregates numeric Jira field values and displays them on dashboards by month, week, sprint, or another date field. It provides line, bar, stacked bar, pie, and table views, with grouping by issue, epic, assignee, dropdown field, or custom field. The add-in also supports issue counts, story points, cumulative flow diagrams for issues, and grouping of related issue types.
Sums values from numeric Jira fields, including fields such as story points.
Groups numeric values by month, week, sprint, or another date field.
Provides line, bar, stacked bar, and pie charts for aggregated values.
Displays aggregated numeric values in a table.
Groups results by issue, epic, assignee, issue type, dropdown field, or custom field.
Provides a cumulative flow diagram for issues.
Numeric Custom Field Chart is free and cloud-only, while ChartCraft for Jira is freemium and cloud-only. Charts - Reports and Graphs for Jira Dashboard is free and cloud-only, was updated in Sep 2026.
| Name | Pricing | Deployment | Updated |
|---|---|---|---|
| this plugin | Free | Cloud | |
| ChartCraft for Jira | Freemium | Cloud | |
| Charts - Reports and Graphs for Jira Dashboard | Free | Cloud |
630 plugins in Jira · Data and analytics
Price distribution: 189 free, 230 freemium, 211 paid
Build Jira dashboards with charts, workflow metrics, custom-field analysis, and PNG or CSV exports.
White Software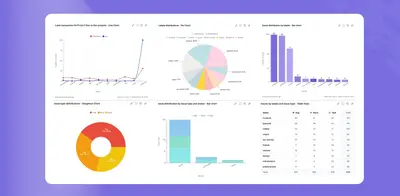
Create Jira dashboard charts and reports from issue data using multiple visual formats and filters.
Yamuno Software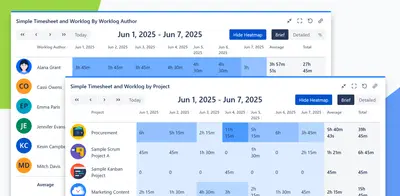
View Jira time records in a dashboard with grouped timesheets, optional heatmaps, printing, and CSV export.
Agilis LT (Simple Reports)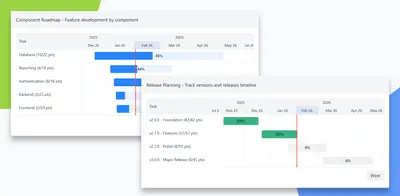
Creates Jira Gantt charts and roadmap timelines from work items, with configurable grouping and progress tracking.
Agilis LT (Simple Reports)«Sum up any numeric field value like story points by any date field value in project and output monthly, weekly, sprint, any numeric field or dropdown field report on dashboard. Line chart for sum of any numeric field value per issue, epic, assignee or any custom field. Bar chart for sum of any numeric field value per …»