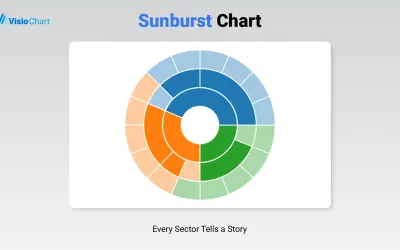
Sunburst Chart
Displays up to five levels of hierarchical data as proportional segments across concentric rings in Power BI reports.
VisioChartFreemium
Displays individual category values alongside a separate total bar in Power BI.
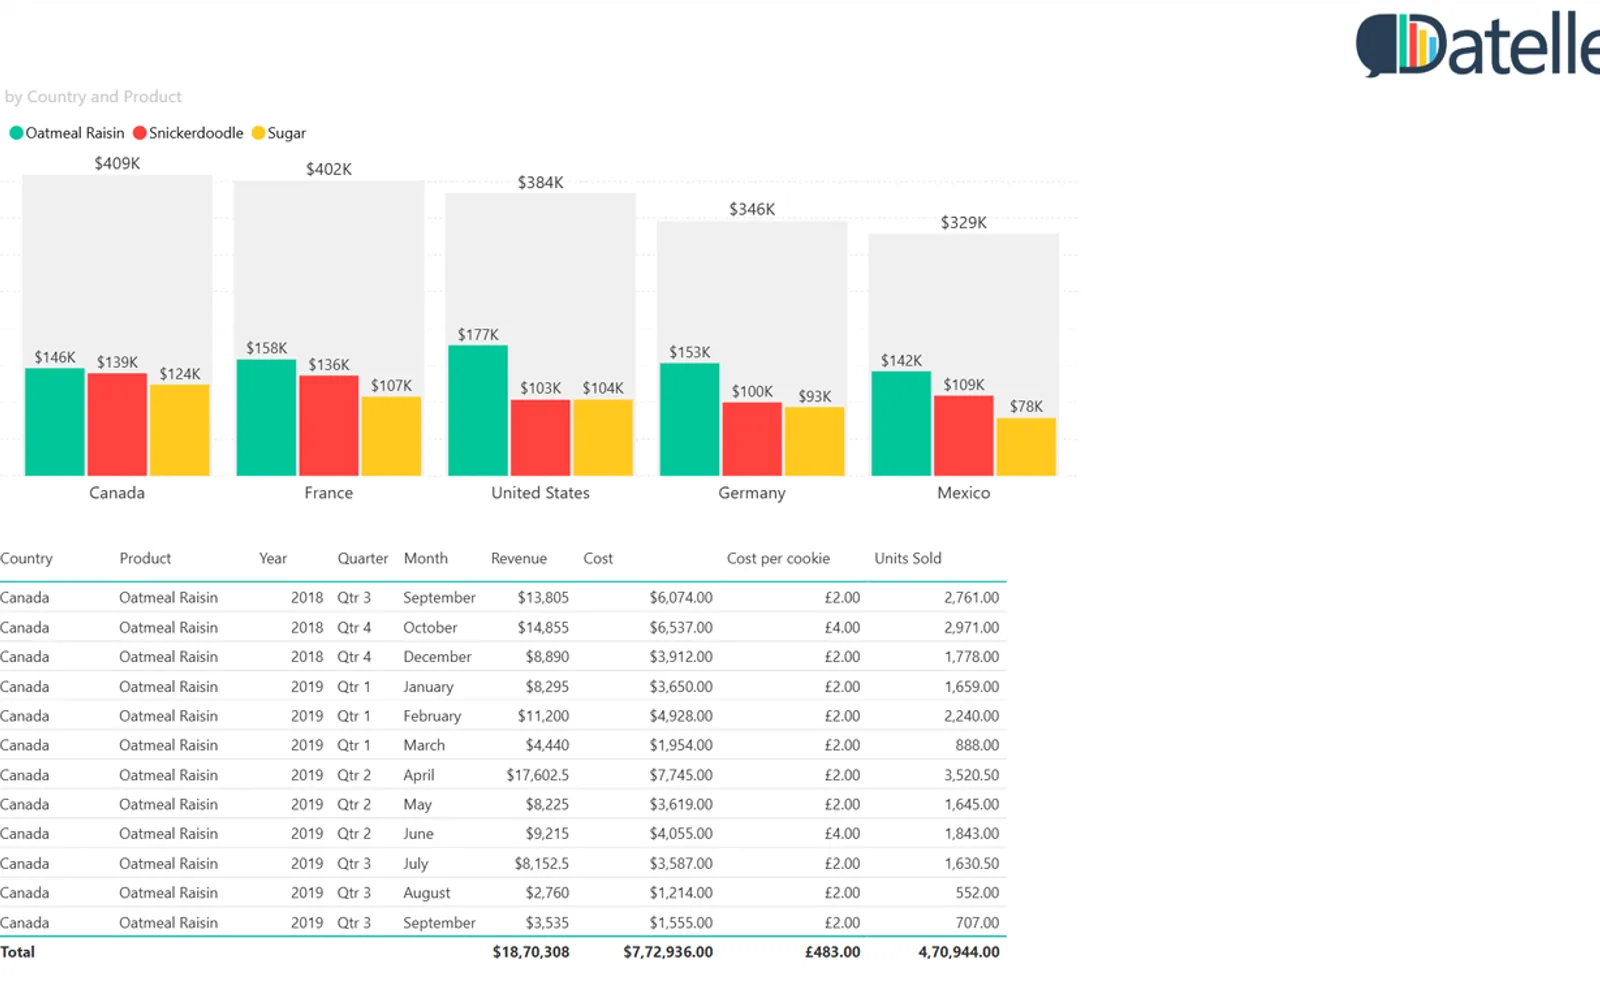
This Power BI custom visual displays individual values and the overall total for each group. The total appears as a separate bar above each group, while individual bars show component contributions. It presents contributions, proportions, and totals across categories. The vendor lists financial contribution analysis, department or product comparisons, and budget versus allocation breakdowns as example uses.
Displays the total value for each category as a separate bar above the group.
Shows individual bars for the values contributing to the overall total.
Presents individual values and totals across categories.
Displays contributions and proportions within the overall total.
The vendor names analysts as users of the visual.
Datellers Nested Total Bar Chart is paid and cloud-deployed, and was updated on Jul 2026. Sunburst Chart and Bullet Chart - xViz are freemium and cloud-deployed, with updates listed as Dec 2025. PieChart by iFour and 100% Clustered Stacked Bar Chart (Standard) are paid and cloud-deployed, with updates listed as Nov 2025 and Apr 2024.
| Name | Pricing | Deployment | Updated |
|---|---|---|---|
| this plugin | Paid | Cloud | |
| Sunburst Chart | Freemium | Cloud | |
| Bullet Chart - xViz | Freemium | Cloud | |
| PieChart by iFour | Paid | Cloud | |
| 100% Clustered Stacked Bar Chart (Standard) | Not in catalog | ||
657 plugins in Power BI · Analytics
Price distribution: 73 free, 108 freemium, 441 paid, 35 price not published
Displays up to five levels of hierarchical data as proportional segments across concentric rings in Power BI reports.
VisioChart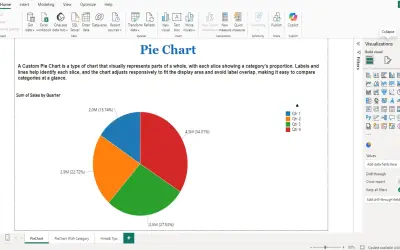
PieChart by iFour divides data into colored slices to visualize parts-to-whole relationships within Power BI reports.
iFour Technolab Pvt. Ltd.
Power BI visual for comparing actuals against targets, with IBCS-certified bullet chart templates and comparison bands.
xViz LLC dba Lumel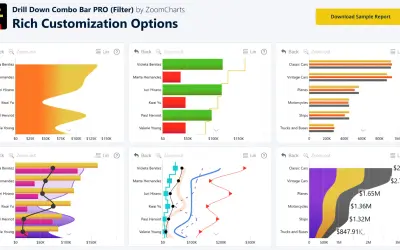
Sign up for a Free Developer License and get 1 year access to this and 20+ ZoomCharts visuals for use in Power BI Desktop!
ZoomCharts«Make total comparisons easier with a clearer alternative to stacked bar charts. The Nested Total Bar Chart by Datellers is a Power BI custom visual designed to simplify how users compare individual values against their overall total. Unlike traditional stacked bar charts, this visual displays the total value as a …»